A snapshot of current daily technicals…
Precious Metals
GLD dropped below and shot back above support. Key objective: Get above 120 and make a higher high to October.
SLV broke a trend line. Tune that down and focus on noted resistance area, which includes the SMA 50.
SLV-GLD is still below resistance and needs to break out above the SMA 50 to signal relief in precious metals and potentially, commodities.
GDX found resistance at the SMA 50 (20, which was our initial ‘bounce’ target) and must exceed it to extend the rally.
GDX-GLD would get constructive for the sector above the noted resistance line.
SIL must hold support here. Any lower would be a break down.
GLD-DBC continues to support our big picture economic contraction thesis and an improving fundamental backdrop for gold miners.
GLD-USO is obviously supportive as well.
GLD-SPY, not so much. Until gold rises vs. the stock market, the sector will likely not gain much bullish attention.
Commodities
DBC is in terrible shape, bounce potential or not.
USO is awful as well. It does not mean energy is not on sale and a long-term value, but like commodities in general, oil’s charts are broken.
UNG made a big failure on Monday.
URA is still on predictable come-down from the Japan hype.
DBB has dropped from resistance, right to support. Looking bearish below the moving averages.
COPX is a mess. In this market, constructive looking patterns are made to be broken and this one broke down right at the SMA 50.
DBA is still below the SMA 50 and is still going nowhere. 2 steps for DBA to get bullish… 1) SMA 50, and 2) the noted resistance line/SMA 200.
Bonds
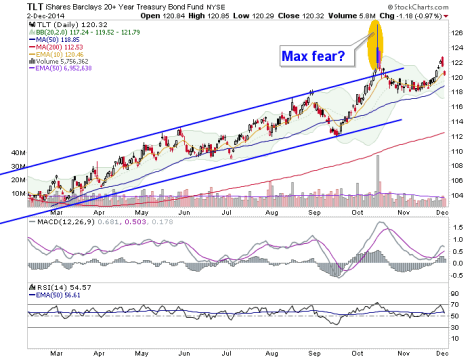
TLT is dropping from what would be the channel top. Support would be around the SMA 50.
HYG vs. TLT continues to indicate a negative divergence to stocks.
Stock Markets
SPY dropped, filled a gap and then bounced and filled another gap. MACD looks highly suspect.
QQQ still fine way up there. Over bought, suspicious MACD and still fine as of now.
IWM is having trouble again, presumably in light of the stronger USD. This chart shows a few things, including how a DEATH CROSS is nothing but hype as the MA 50 crossed below the 200 and then IWM rammed up to 5 month highs. That said, this chart looks suspect, by MACD and RSI.
SMH is still bullish and about as far above the 50 day MA as it gets. That means it is over bought.
EWC failed support and turned it to resistance after not attaining the measured target.
EZU is still above support after breaking the trend line. I’ll try to find some currency hedged charts (ref. NFTRH 319) to manage Europe going forward.
EWG came up to the resistance noted last week and is dwelling below it. Germany is one of the ones that could be interesting on corrective opportunity.
EWP continues to be constructive above 38. Interesting how Germany went down yesterday but this junk went up. Thank you global CB’s for the speculative atmosphere.
EEM failed resistance and continues to look suspect.
FXI popped above resistance, now the most tentative of support.
DXJ… so much for our ‘wait for buying opp’ on Japan stance.
Currency
UUP is at a new recovery high. The second chart is the USD monthly, because big perspective comes into play here. Uncle Buck is now over loved, over owned and at a very important long-term resistance level.
FXE remains bearish, below short-term resistance but with some positive divergence by MACD and RSI.
Bottom Line
Precious Metals: Still bearish but also still in bounce mode. Parameters to what would be an extended rally are noted above. The volatility of the last week has not broken the bounce. But there too, support parameters are noted.
Commodities: Very bearish. Also very over sold and prone to bounce if USD finds resistance.
Bonds: Long-term Treasuries uptrend intact, encountering a pullback. Spreads between junk and quality continue to indicate an unhealthy divergence for the stock market.
Stock Markets: The ETF update usually sticks to pure technicals, but today I’ll call your attention to this post, simply because it adds another layer to the risk profile of an over bought US stock market.
S&P 500 and Monetary Base, Not Reassuring
Can it keep going up up up? Sure, bubbles tend to do that. But unhealthy indicators are popping up left and right.
Europe and Japan continue to be interesting to begin 2015 if an interim pullback comes about. Emerging looks weak (with USD at new highs) and China needs to be watched going forward.
Currencies: USD very bullish, over bought and at a major resistance point. Euro very bearish, but would bounce if USD corrects. Yen sucks as do the commodity currencies, which are and have been bearish for so long now. None of these are shown due to time considerations and unchanged status.


