
I want to update some very interesting things I see in the precious metals patch. And I want to go into detail. In other words, this update will probably serve as a significant part of NFTRH 937’s Precious Metals segment this weekend. Just ahead of time, because I want to express it now, not over the weekend.
This assumes the week will close near the current state of things, otherwise I’ll revise these views in #937.
Silver
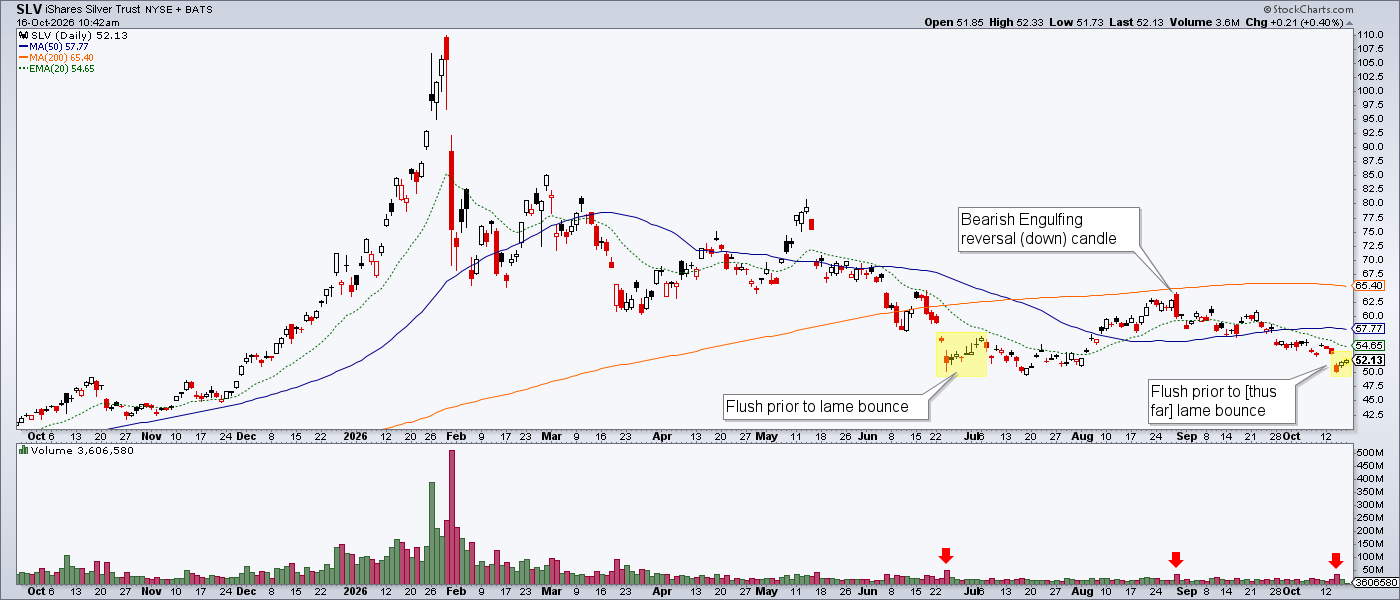
Silver dropped out of the wedge and made a thus far successful test of the July 17 low. I took note of this because silver tends to end its corrections with a downside swan dive. Was that a swan dive? Well, it was a flush and it did come on a volume bump (per SLV chart below). It also came from a valid test of the lows, which in a bullish case is what we’ve been waiting for.

A look at an SLV chart would show that the day of the recent breakdown low had higher volume than all of the others around it. Similar volume bumps occurred in June (after a similar plunge to the recent one) and preceded a weak bounce only.
Then there was the late August tick to new highs, reversal and bearish engulfing candle, which set silver back on its way down to the test of the lows. Thus far, if it holds its current flag structure and volume remains weak, it’s likely a bear flag. In that scenario silver could really shake ’em out to the downside and provide the kind of buying opportunity I am waiting for in the trading account. A final, terrifying plunge. We’ll see on that.
Silver Bottom Line
A thus far successful (higher low) test of the lows is in progress. This could spring a new bull leg to the bull market. But volume is not yet in the picture and the candles have the look of a rising bear flag (given the lack of volume thus far).
If silver were to fail the July 17 low of 54.77 we could set up a whale of a buy. Silver does not tend to bottom quietly.
What makes the most sense to me is to watch to see if silver can gain volume and break upward from the pattern and eliminate the bear flag. If so, I will be more than happy to climb aboard (silver & silver stocks) for a trade, if not a new bull leg. If it breaks down in a violent plunge to a new low the buy opportunity – white knuckles and all – would be at hand.
Gold, etc.
Gold is spending its second day in wedge (bull flag) breakout mode. This after a thus far successful test of the lows. If I were looking to buy more gold, I’d be adding here because gold is long-term value, not a price mechanism.

And if the Gold/SPX ratio bottoms here I would get very serious about gold stocks as well.

Meanwhile, the Gold/Silver ratio is bullish…

…while USD starts to lose its breakout.

While the HUI/Gold ratio hangs tough after hitting our precise target at the SMA 200 and bouncing.

Bottom Line
I am actually feeling somewhat spring of 2025-ish. Back then gold was firm, gold stocks were relatively firm compared to most stock sectors and silver was taking its final nosedive before the massive rally in precious metals and critical minerals erupted.
It’s not to say all elements are as they were. We’ve got a goddamn war going on, and all. I’d watch for continued relative strength in gold and the miners. If that happens and silver either bottoms or takes a final swan dive, it would be time to prepare for a bullish 2027, if not sooner.
Let’s add a new element to keep on watch, the HUI/SPX ratio. If this sucker puts in a low and rises from here it could well be spring, 2025.

