

Summary
A brief summary of the work done in this week’s report and in the updates and reports leading up to this point. Please read the detailed report for the complete picture. There are many granular details that cannot be summarized so briefly.
[new comments in italics]
Precious Metals (bull market)
Sector firmly in correction. Whether or not the final low is in, the sector is at much-reduced risk. Any bounce from here could be just that, a bounce. But given the length of the originally anticipated “multi-month” correction (now a half year), any bounce from here could also be the start of a real bull move.
The bounce finally came and it looked impulsive. It could be a launch to the next phase of the bull market when factoring volume and intensity. HUI, GDX & GDXJ each at least temporarily took out their 200 day averages, which is the 1st step to break the multi-month downtrend.
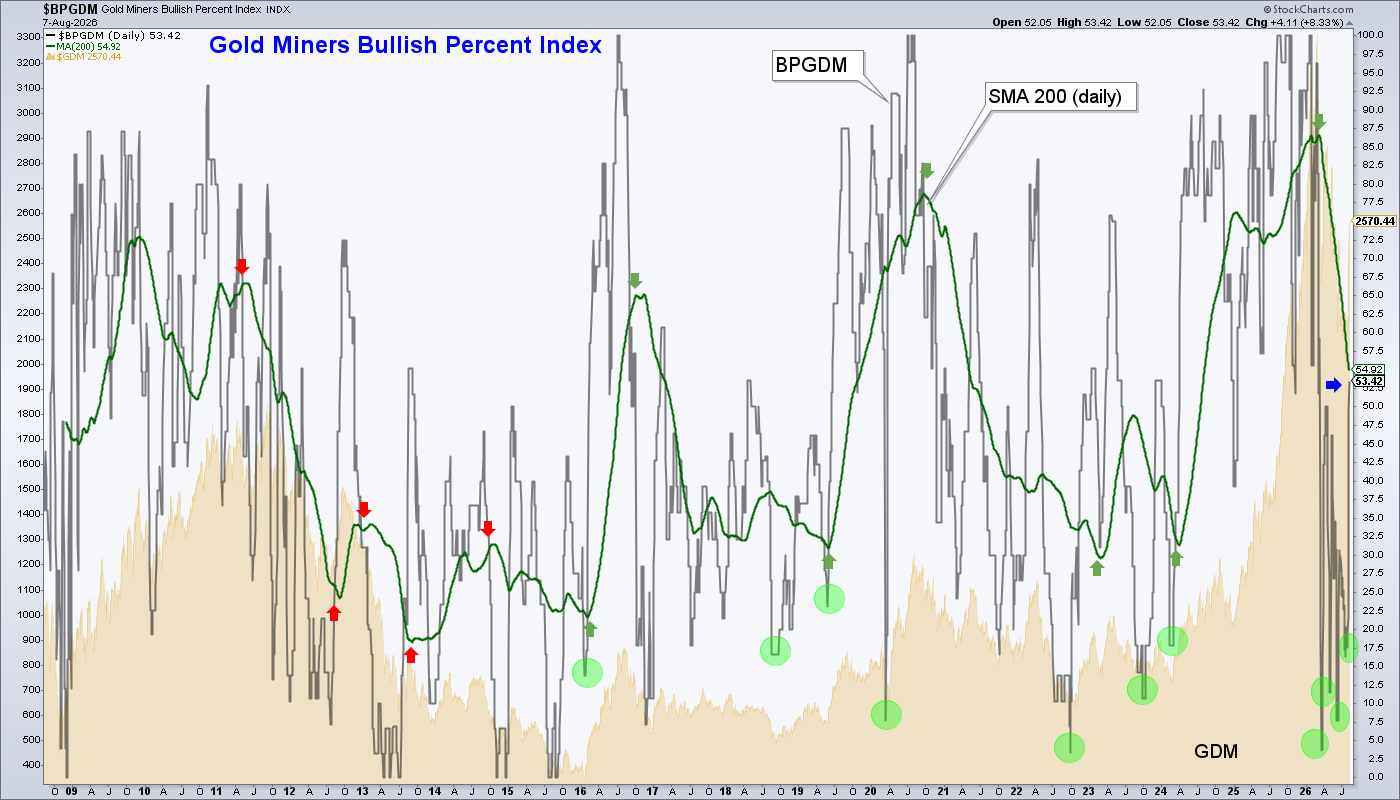
It could get volatile from here. Among the best factors are the 6 month duration of the correction and BPGDM’s 200 day moving average, which we have been noting lately has done its job in resetting overbought to an oversold bullish situation within a bull market.
US Stock Market (bull market)
The pig just will not crack. Or will it? Its leaders, SOX & NDX, have cracked and they should be watched closely this week for broader indications. The leaders have bounced, but only to resistance.
NDX took out resistance and SOX looks like it is going to. Meanwhile, SPX is flying around in rarified air. It appears ‘bull on’ toward, to or through the election, per plan.
Global Stock Market (bull market)
Watching closely for global participation in a 2003-2007 style anti-USD trade where global out-performs the US. It may have already started. If that is the case, China/Asia, EM, Canada and Australia are favored.
Global is flat out bullish, on balance. Despite SPX jump to new all-time highs the ACWX (world)/SPX US) ratio maintains its post-inauguration uptrend potential. If Trump is making America great again, he’s making the world greater. It should be noted that the former downtrend dated all the way back to 2008. A trend change here would be profound, and likely a death knell for the US dollar as a functioning reserve currency.

L/T US Treasury Bonds (bear market)
I was wrong to anticipate an interim rally. Regardless, a bear market is a bear market. The rise in rates on the longer ends of the curve are pressuring the Fed to raise rates.
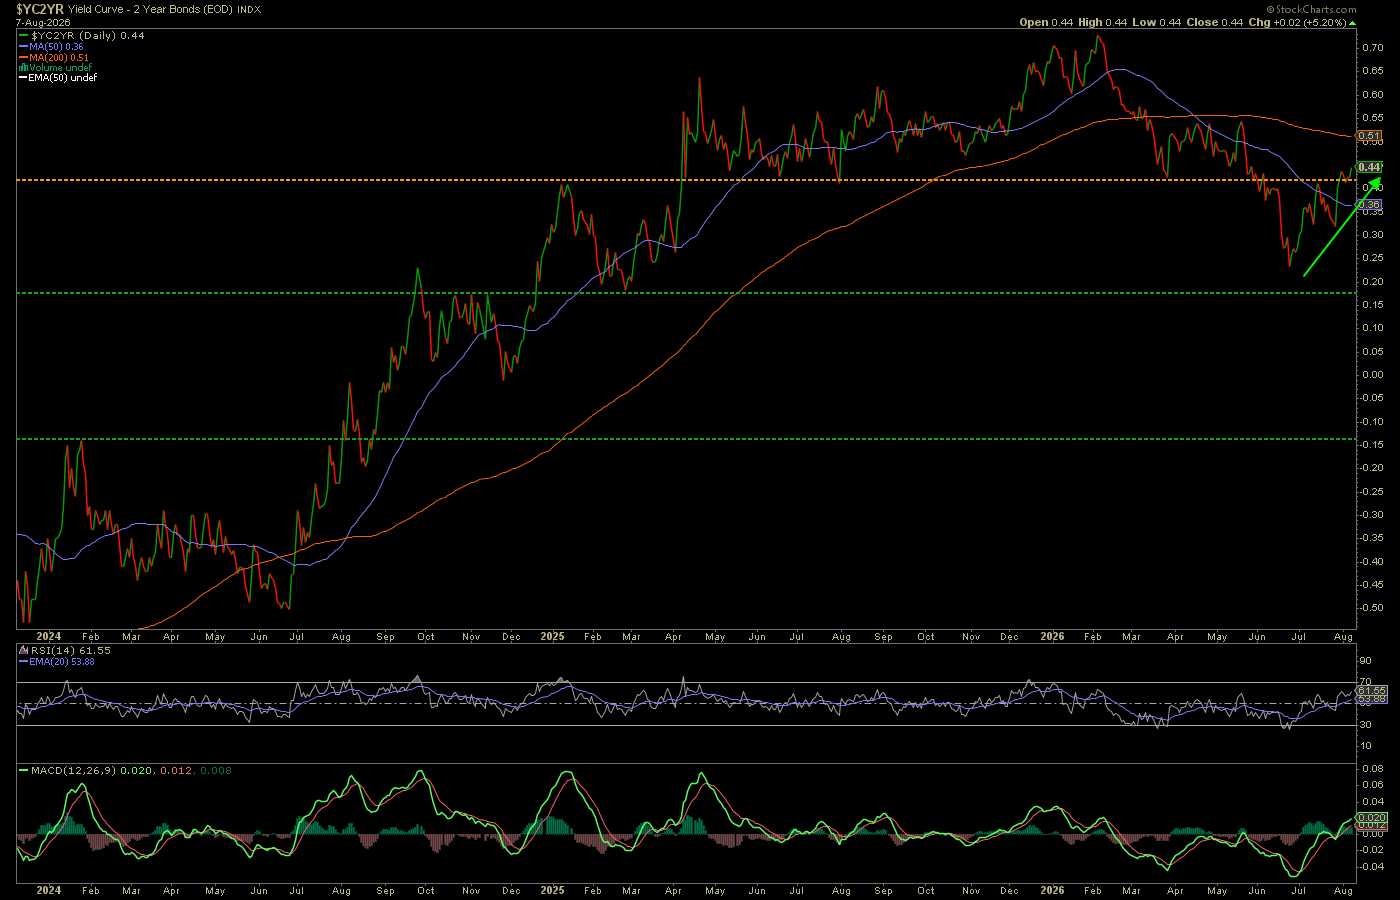
Long-term Treasuries are still aiming south (yields north), but short-term Treasuries are bullish and paying out income while providing a risk haven. This is resulting in a re-steepeing of the 10/2 yield curve. That tends to be gold positive, along with the stuff that follows (silver, commodities, etc.).
Commodities/Resources (bull market)
Watch the Silver/Gold ratio. Meanwhile, it appears time to discretely nibble at favored items.
Nibble I did, adding REE, a bit more u3o8, some Li and even Fertilizer. I also added a second position in TLO.TO (TLOFF), which means I added some more Ni & Cu in the ground.
US Dollar (short-term bullish, post-2008 bull market)
US Dollar (mega long-term bear market)
USD got clubbed last week. Has the anti-USD “inflation trade” begun? Stay tuned.
It hung around the previous week’s lows, deciding whether to fail at the support of the 200 day average or hold it and produce a summer surprise (the turd in the summer party’s punchbowl type). USD is at a perch from which it can rally. Just reading the chart, folks.
NFTRH 927 is delivered on Saturday just to make sure there are no issues with our still temporary internet connection tomorrow. Now activation has been pushed out to Tuesday. It’s frustrating, but I want to make sure I get product to you ASAP and take no chances.
Precious Metals
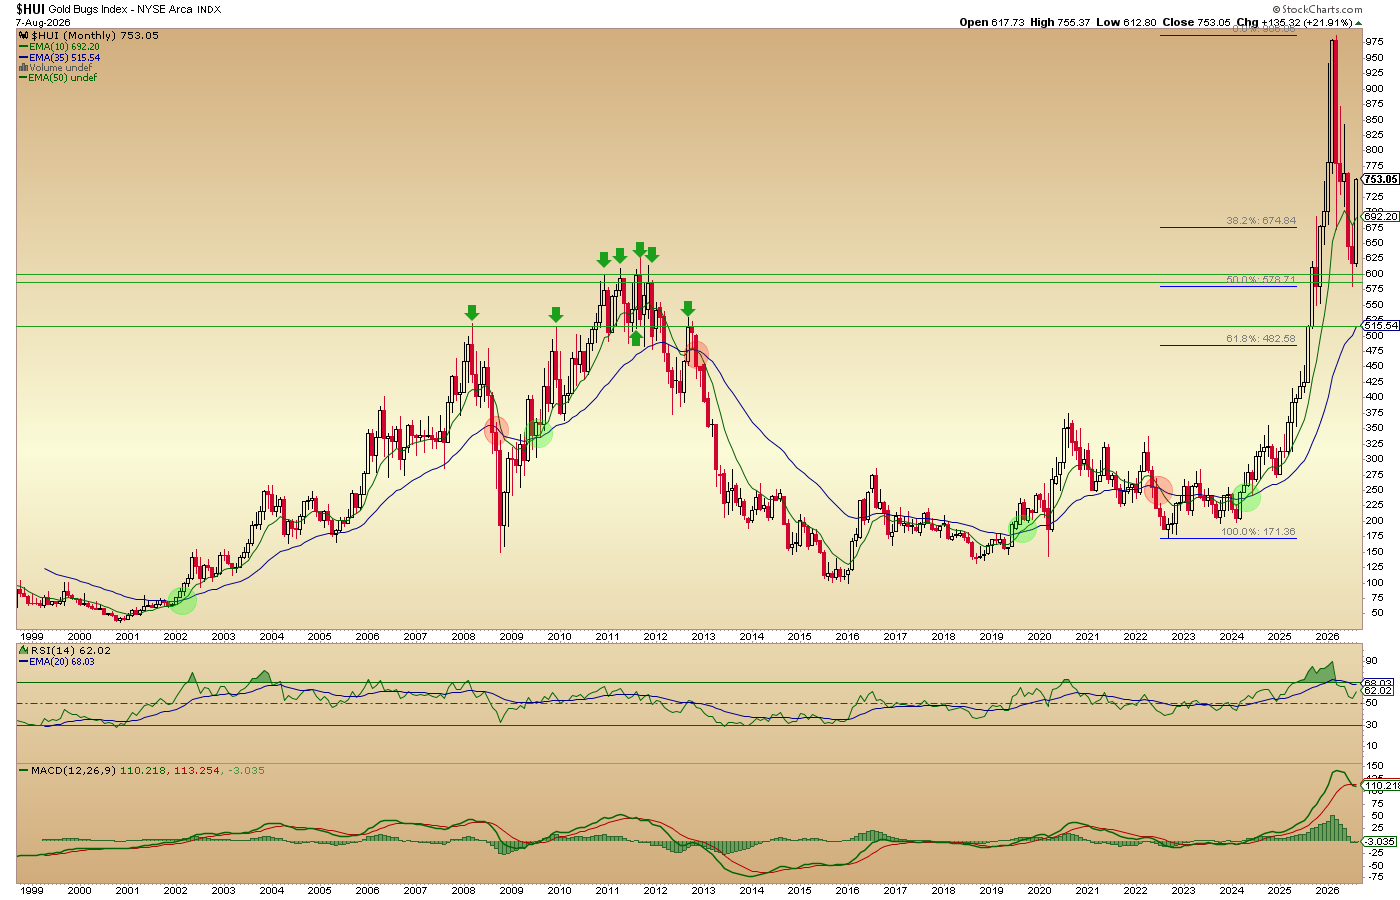
Let’s start with the star of last week’s show. HUI (and gold stocks) had enough of the wedge downtrend and blasted upward. GDX and several miners showed volume (conviction). Predictably enough, there’s the fabled moving average “Death Cross” reaction in the opposite direction implied (sometimes it takes a while).
But understand that a cross can have efficacy some time after the confounding reaction. In other words, a new major down trend may have begun with that cross, which would be seen with time. However, quite often the 50 eventually crosses back above the 200 and off we go.
All of that is to say “let’s pretty much ignore it now that the likely bounce has become the actual bounce). This is a strong rally at least, and a new bull market move at most.

As noted, the miners did enough good work, both in time of correction and in resetting from overbought. 6 months in the desert will do that. The BPGDM flashed low risk as the low-moving 200 day moving average trended down nicely. It takes patience, compared to the spastic stuff going on with the indicator itself.
So now the noisy indicator has bounced all the way up to 53 (blue arrow), coincidentally its 200 day average. That is noise. The sector is going to be volatile, up and down. But that SMA 200 has come way off its danger point around 86 and if the bull market trend is to stay intact (i.e. SMA 200 not destined for a lower low), there should be a lot more bull to come over the coming months, well into 2027.
HUI’s big picture did all that was asked of it to be a legit correction. Could it have gone lower? It’s the gold stocks, so we held open a disgusting 62% Fib potential pullback. Instead, the 50% Fib was held with conviction. That was the original favored pullback level a greedy buyer might have dreamed of back in January.
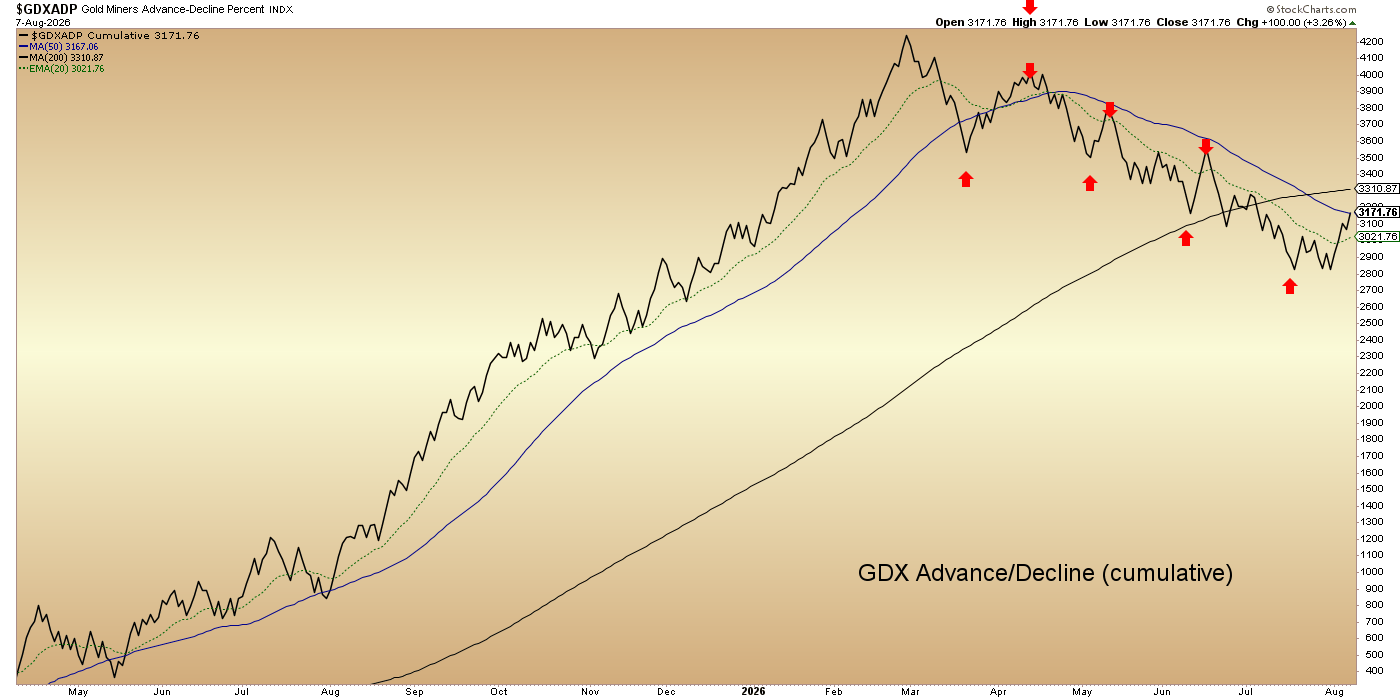
We want to see indications like the following start to kick into gear to manage a new bull market leg situation.
GDX A/D line needs to break out above the moving average congestion to signal that the sector as a whole is catching on. Let’s remember, it was just one week of hysterical activity. So far, it’s a bounce. We want a trend change in indicators like this and in the indexes.
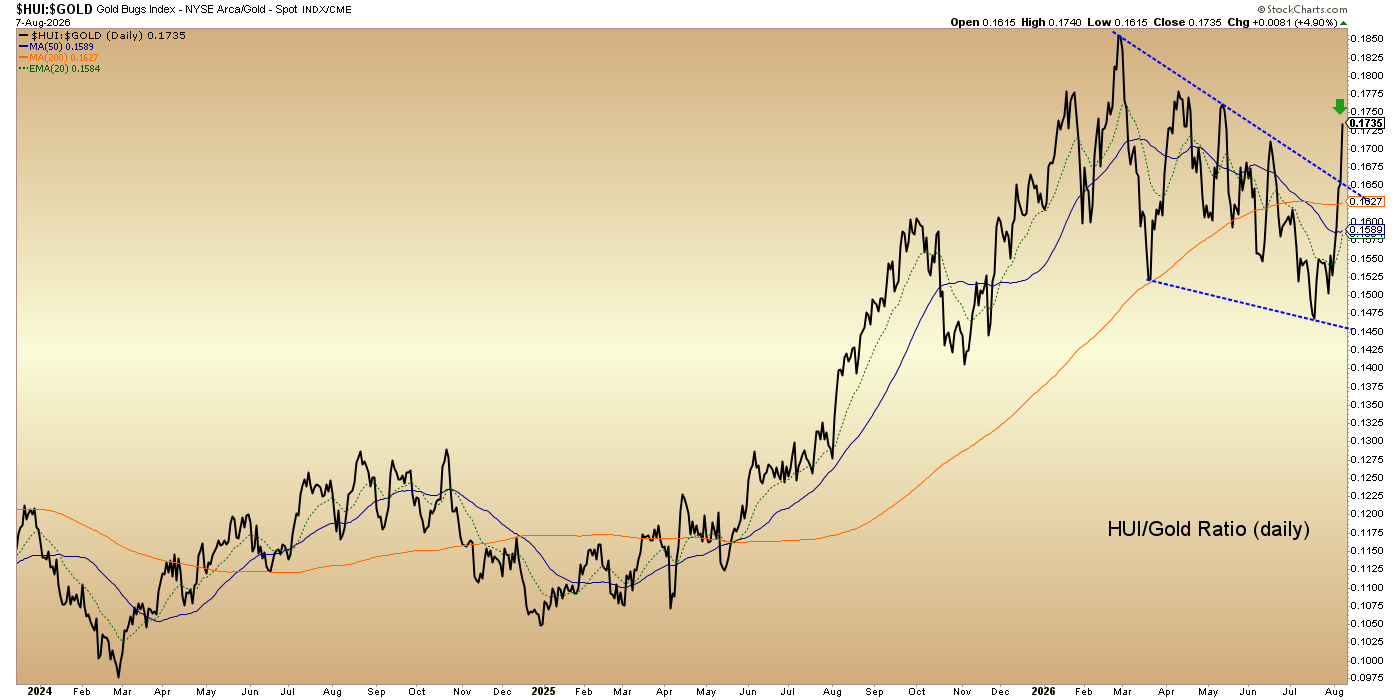
HUI/Gold ratio shows no negative divergence to last week’s bull show. Indeed, it is a positive internal guiding the sector higher as long as the ratio holds the moving averages it broke through.
We will also want to see gold resuming upward vs. the ‘inflation expectations’ gauge RINF in order to attain and keep a healthy macro funda situation for gold mining.
You might look at this chart and think ‘oh boy, the miners are way stretched vs. Gold/RINF’. But think about it, the 2025 rally was all about the proper fundamentals. That is the backdrop that gold miners leverage positively for outstanding gains. The first half of 2026 was all about weakening fundamentals. But the point is that what happened positively in 2025 was more powerful than what has happened negatively in 2026.
In my view the relative strength in HUI can be interpreted as another bull market signal, like the BPGDM’s 200 day moving average and even the HUI/Gold ratio above if it resumes its uptrend. In other words, in a proper macro HUI is supposed to have far exceeded ‘inflation expectations’ and even the gold price.
Think back to 2007-2016. That was a very improper macro, mainly compliments of Ben Bernanke and his Op/Twist and 7yr ZIRP blight. A complete rig job. Back then, to the consternation of many, the gold miners also leveraged the macro… to the very negative side. As they were supposed to! The bugs just didn’t want to hear it.

We will not review charts of individual stocks because all the ones I hold have spiked and that tells us nothing. When the turbulence arrives and if buying opportunities arise, we will surely chart them (here or in updates).
To this point, the goal was to manage the sector’s bottom-making and, I assume, be ready to buy your beaten down stocks of choice. As noted in the daily subscriber blog (I changed the name to what it actually has become) on Friday:

Bottom Line
The precious metals complex may have bottomed. Gold and silver rallied as well, but both are still below clear resistance and the 200 day averages. That said, I added gold/silver fund CEF a couple weeks ago and it’s sporting a solid paper profit.
While it is impossible to know for sure that the ultimate bottom is in, we do know that as long as gold stocks lead gold and inflation expectations ease relative to gold, BPGDM’s excellent ‘higher low’ in its 200 day moving average can be viewed as a ‘correction over’ signal. We’d also like to see the GDX A/D line break its intermediate downtrend and of course see other aspects of the macro continue to improve.
Like the Gold/SPX (GLD/SPY) ratio bottoming here as as expected.

Like a recovery in the Gold/Oil ratio from the base it has formed.

Like Gold/Copper making a bottom here. Although if the 2003-2007 analog engages, copper could continue to out-perform while gold remains nominally bullish.

Bottom Line
We’re on a strong tradeable rally at worst, and quite possibly a new bull market leg at best. If that second thing proves out, the fuel would have been a half year of brutal correction. Sentiment in the sector was left to the crickets and the fundamentals, while compromised, have not been obliterated.
We’ll want to see real/TIPS yields come down, the yield curve continue to re-steepen and gold make good relative bottoms to cyclical markets like stocks and certain commodities.
While some miners got dinged on earnings, the majority did not. And now as we exit earnings season the sector is ramming higher. What does it see ahead? Well, it sure did factor the questionable and macro fundamentals prior to last week. Now it sees something different, better.
It still does appear that silver holds a key to near-term market action, not to mention the longer-term macro.

If the Silver/Gold ratio busts bullish, as it finally did in 2025, it’s going to be party time for a while. Not only in the precious metals, but also global stocks and of course…
Commodities
Copper/Miners: The metal dinged a new high last week and the miners (COPX) are trying to follow. I hold FCX and SCCO, along with some partial Cu plays in CDE, AE.V, TLO.TO, RIO.TO, etc.

Uranium: u3o8 prices continue to trend up from 2020, but have gone sideways since spiking and reversing in February, 2026. URNM is bouncing from support. I hold CCJ, NXE and UUUU. By trusted accounts, the global supply/demand picture is positive. Hence, I’ve wanted to and did buy on this decline to a support level.

Rare Earth Materials: Let’s look at the charts of four Rare Earths. The war had little to do with the big jump in prices. The trade wars beginning in 2025 did. Rare Earth prices are rising, while…
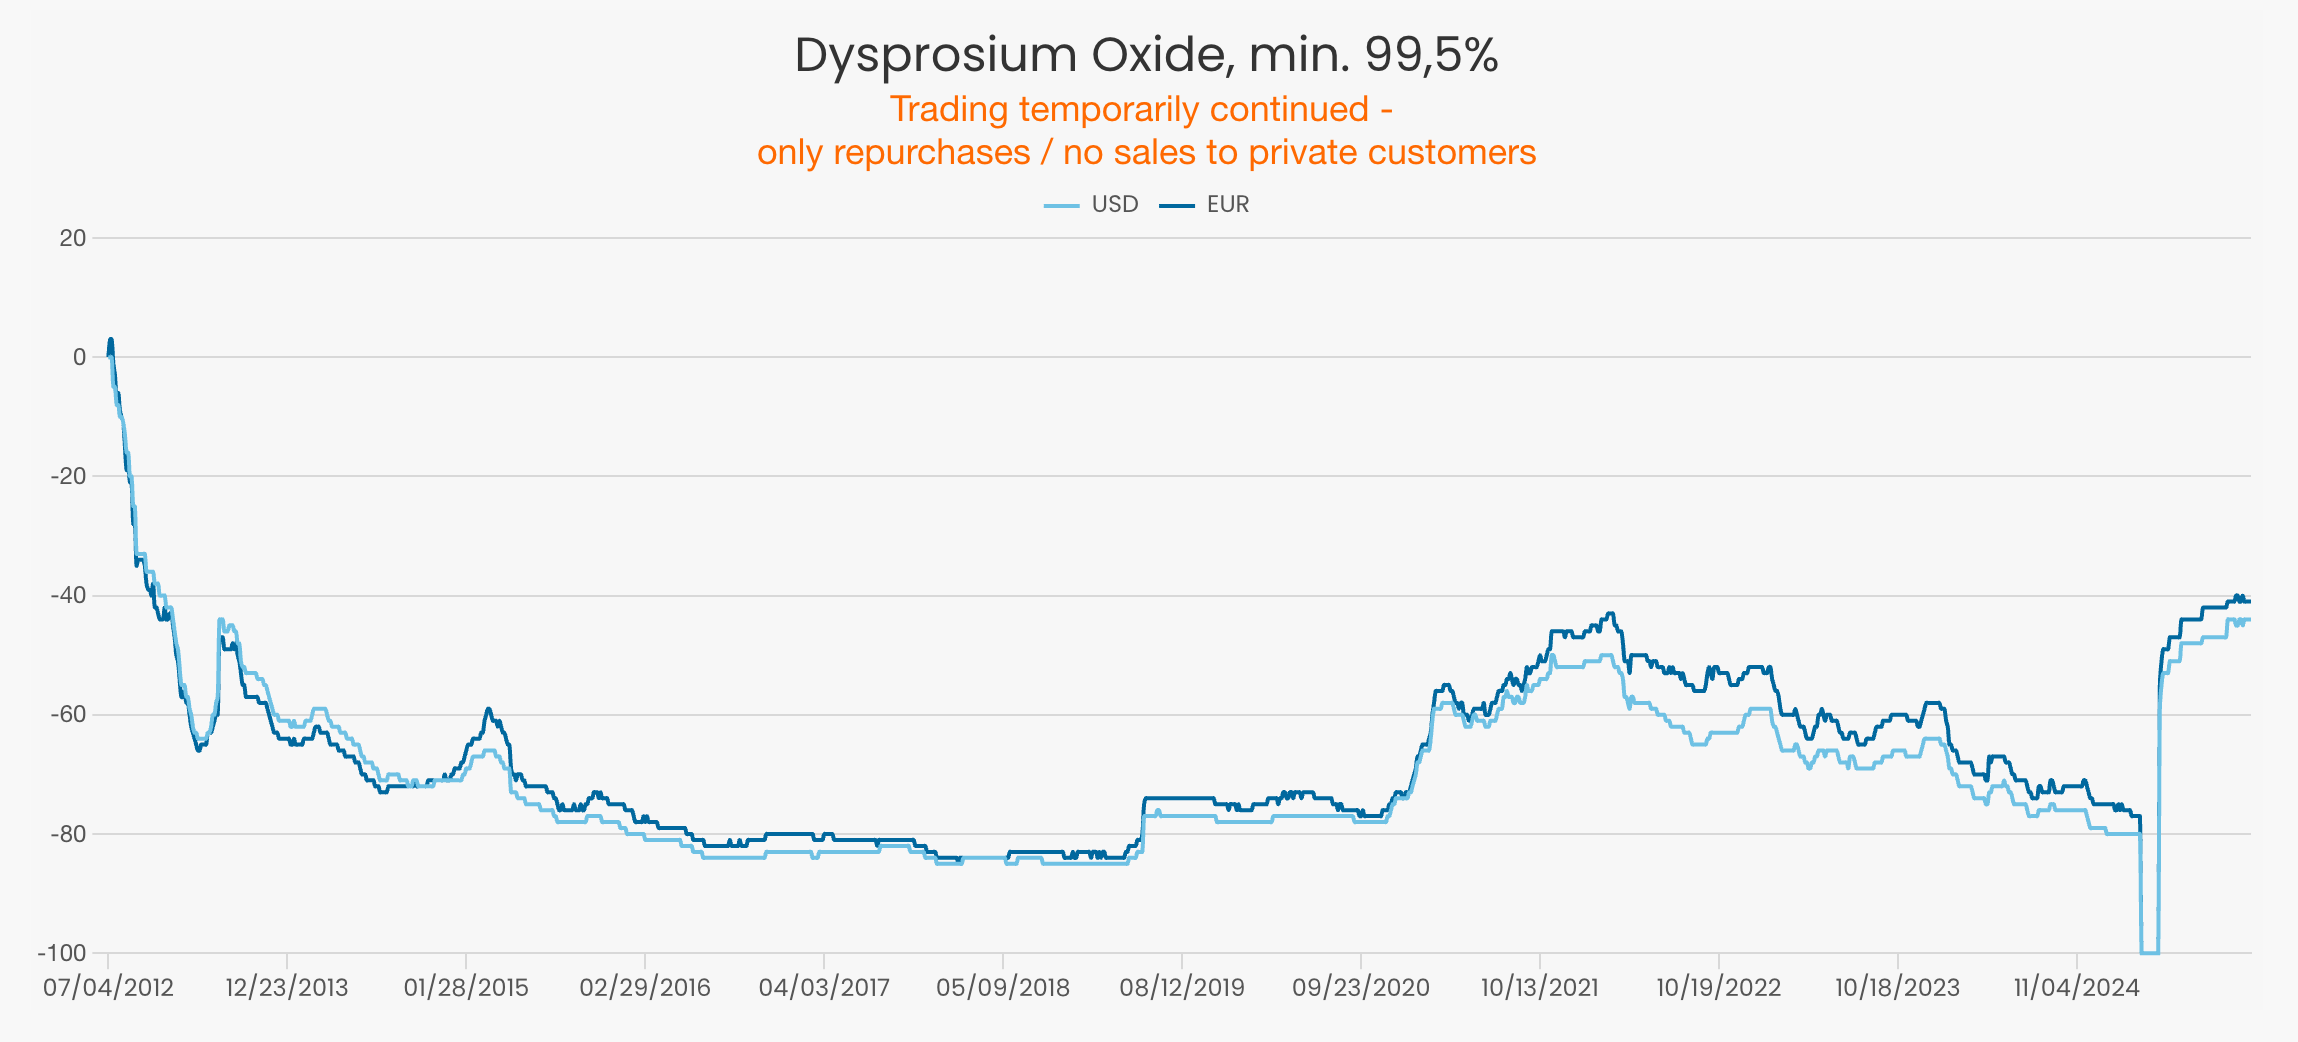
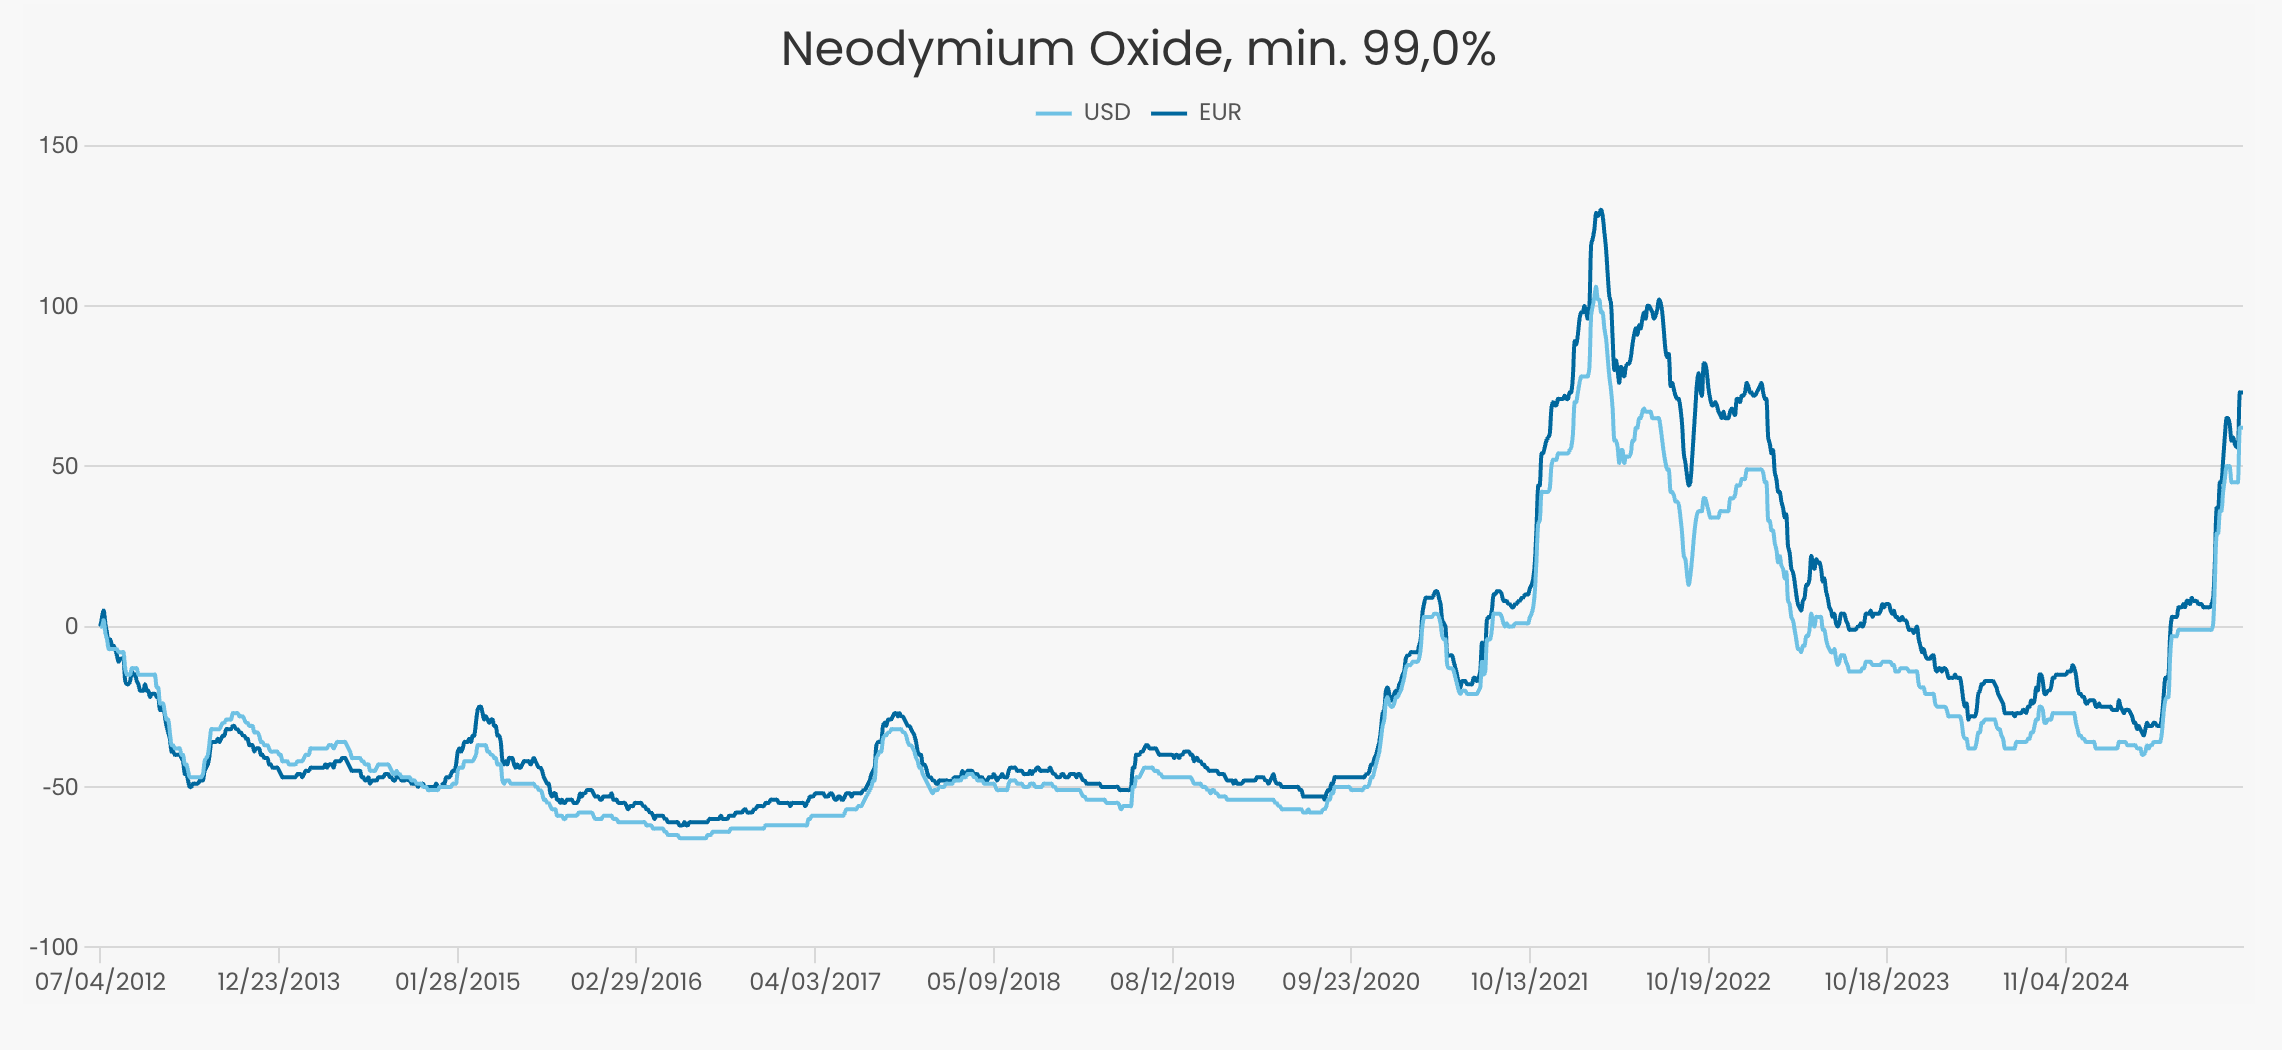
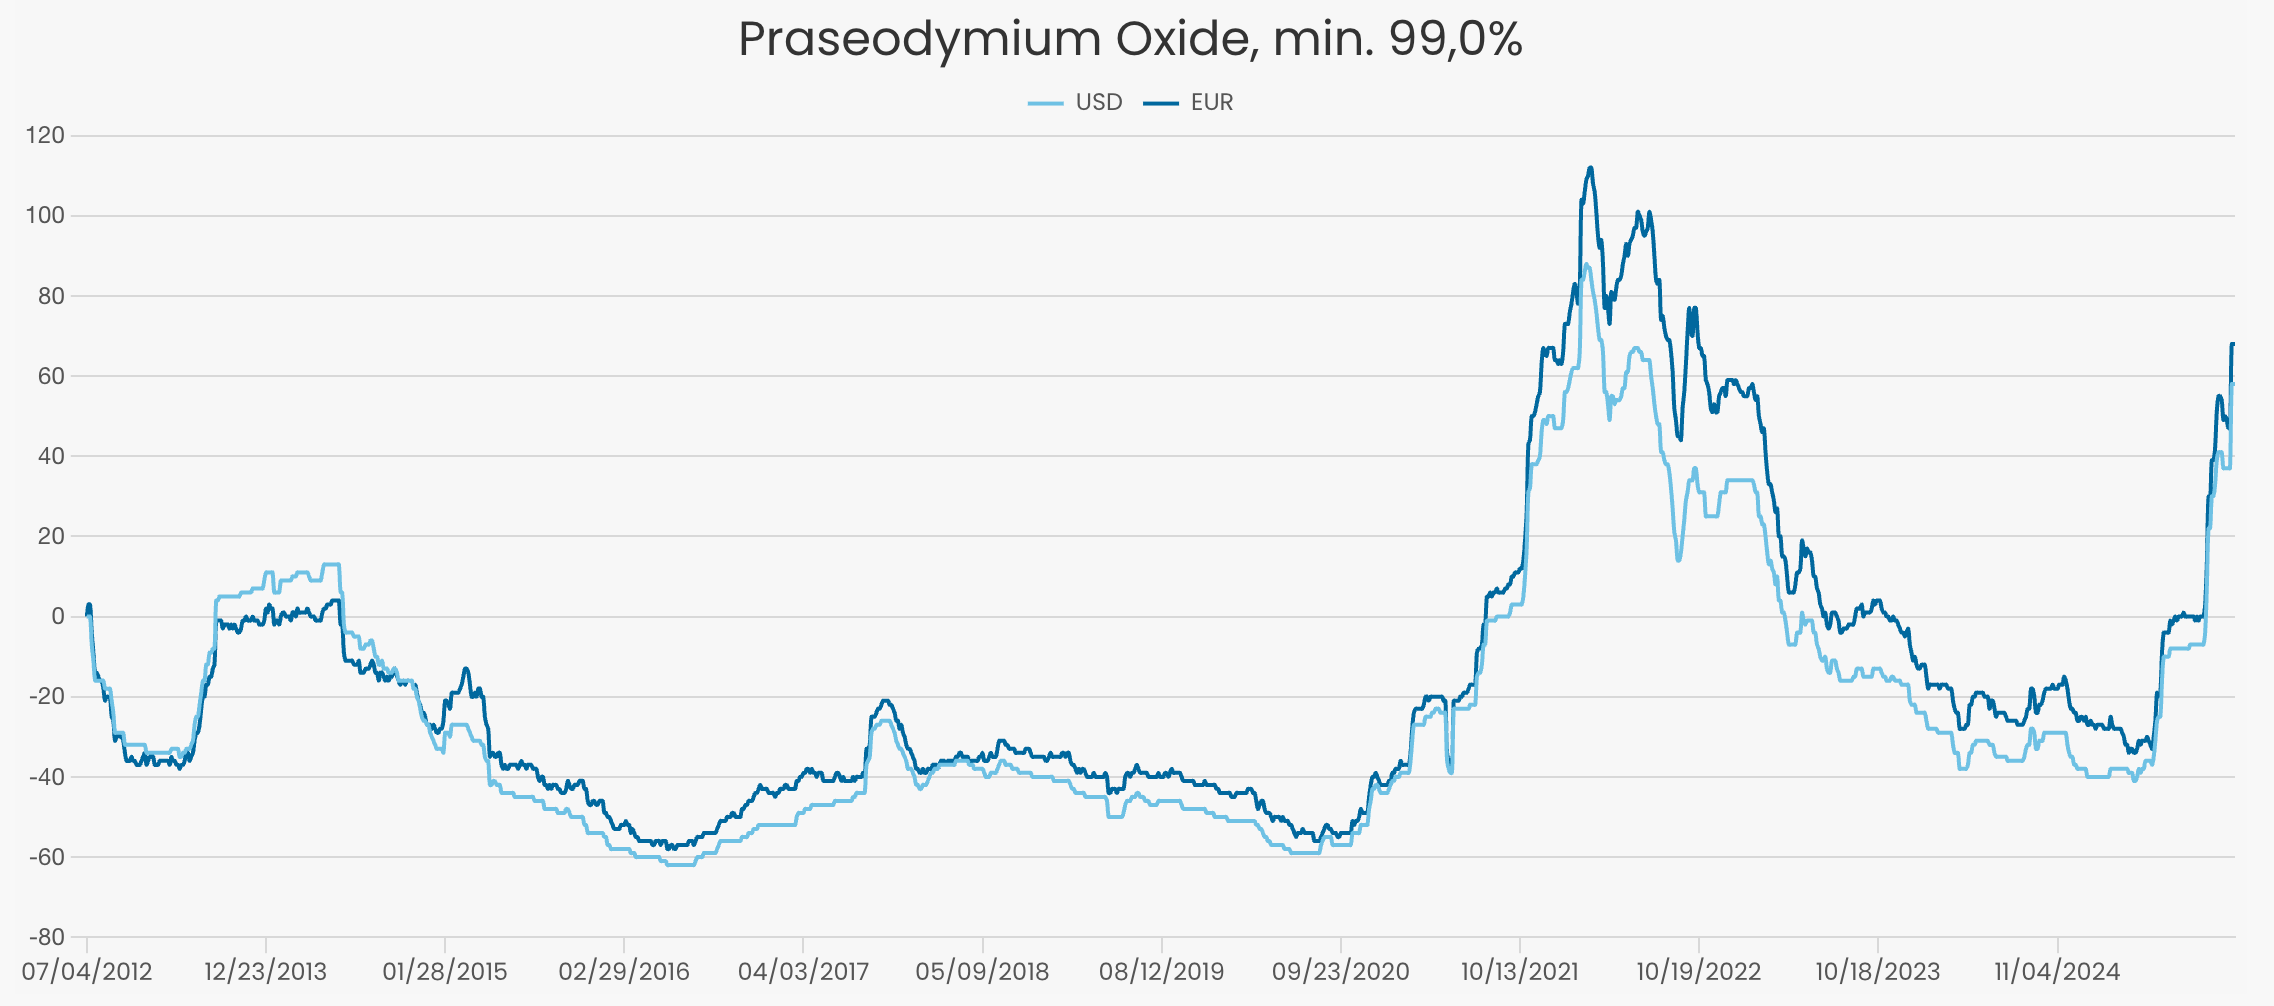
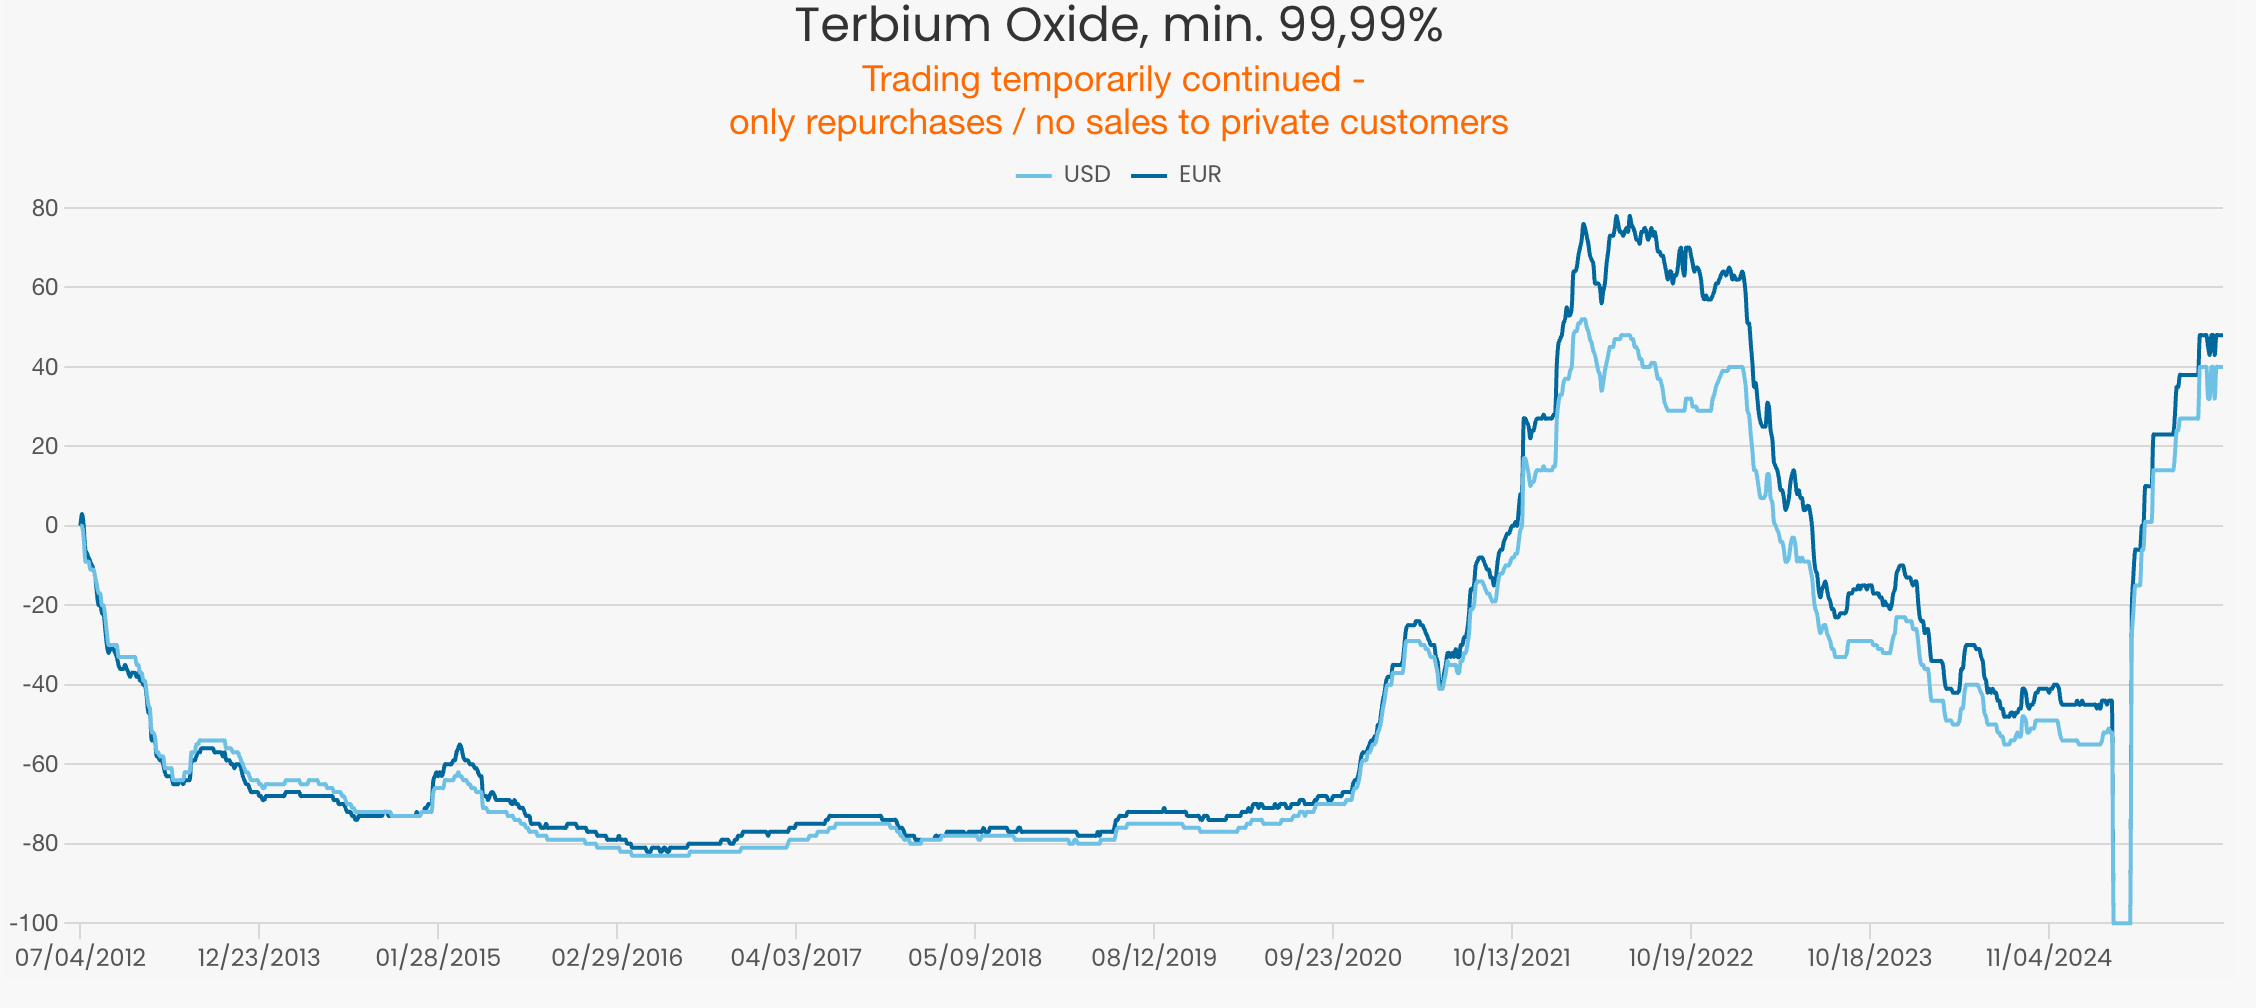
Rare Earth companies’ share prices had been declining.
US producer/processor MP is bouncing to resistance. I have a position, but do not like the chart. LYSDY is also on watch. Meanwhile, bombed out specs IDR and CRML were added and are each sporting decent profits. Others on watch are TMC and ARA.TO (nice chart, but last I checked, the latter requires a $50 fee to buy OTC). No thanks. I’m too cheap. I’ll consider it for the regular account, where I can buy global direct.

Indeed, here is the excellent looking chart of ARA.TO, for anyone with interest. A classic flag to the 200 day average.

Nickel/Lithium: The Ni price is wobbling along mostly sideways in a forever consolidation after the big 2022 spike and crash. TLO.TO (TLOFF) is my choice (hat tip to geo Michael). Li has been consolidating its 2025 rise with a downward bias since May, 2026. I gave ELVR another shot and have SLI, LAC, SQM and ALB on watch as usual.
Commodities Bottom Line
You know my preference. It is critical minerals, of which I include copper.
As belabored, the Silver/Gold ratio is going to be important to the commodity complex. It has not moved yet. But if/when it does many commodity stocks, including the more speculative ones that inhabit the TSX-V index, should put on a show.

Stock Markets
“Never mind your silly Fib grid, I’ve got places to go” said the internally rotating SPX. This has actually been the basis of our diversity theme. Check it out.
Had I not abandoned my gold buggy ways as the sector topped out, the red arrow approximates where the portfolio would have gone. Instead we noted repeatedly that diversity and rotation was the theme. That allowed the IRA to actually increase in value and then grind sideways prior to last week’s jump in the precious metals.
The chart looks a lot more like SPX than GDX, and that is by design. Hopefully it will look a lot less like SPX (in a good way) going forward.
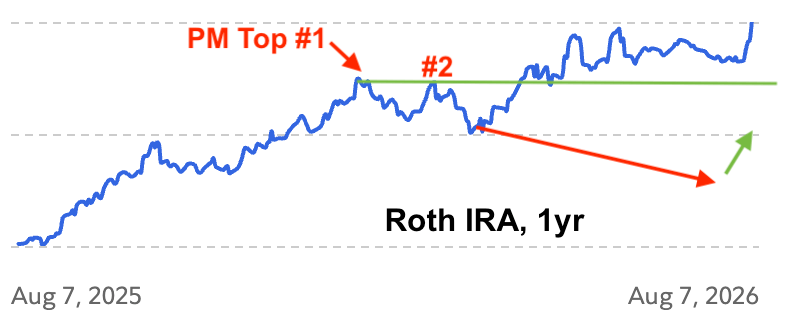
In other words, yeah, I took advantage of SPX’s sector rotations. Whether software, semi, biotech, or what have you. All while waiting for precious metals and strategic minerals to complete their corrections. Are we there? Maybe. Am I going to abandon diversity? No, not yet.
SPX ruined my perfectly good Equity Put/Call bear indicator as it rotated while the purer likes of NDX and SOX took the hammering.

NDX said “screw your Dome, I’m outta here”. As long as it remains above the 50 day average I agree.

SOX has ideas of shredding the SMA 50 and RSI seems to be egging it on. The index did pull a full 50% correction of the rally, which qualifies as a pretty decent summer correction.

SOX > NDX > SPX leadership chain is not yet out of the woods as SOX has not taken over the bull for NDX. NDX has, however, started to do so for SPX. Another key week coming up.

Global Stock Market
The Summary segment above showed the case for global over US into 2027. If the US dollar gets clubbed on cue – perhaps with the 2003-2007 analog, global will definitely be a place to mine positions. And not just mining positions!
We have illustrated that USD is in a bull market from 2008 and a bull cycle from the January, 2026 low currently being tested. USD is not broken even on the short-term. That must be respected until it is no longer the case.

Guys, I am going to skip the Portfolios segment and whatever else I might have included because I am beat after this week. Also, we STILL do not have permanent internet access as Verizon informs of another delay in activation.
In the report above many stocks were mentioned. Others, like VICR, MOS, STRL (still on watch) were mentioned last week at the subscriber-only Daily Market Blog (formerly in-day notes). As I did last week, I’ll just pop in a graphic of current holdings and call it a day.
Portfolios
Gold is long-term risk management & monetary value/stability in a balanced portfolio.
Regular taxable

Roth IRA (non-taxable, no contributions)

Cash & income-generating Treasury bonds are at levels that are right for me and my real-world situation. Your situation is different. Cash will be adjusted as needed.
Refer to the In-Week Notes under the NFTRH Premium menu at nftrh.com for market talk and occasional trading info, if interested. Also, you can follow on X @NFTRHgt for notice of updates.
NFTRH is not to be distributed to third parties without prior written consent
Notes From the Rabbit Hole (NFTRH) is a weekly market report in which we provide analysis on financial markets. We make every effort to provide accurate and high quality content, but this analysis ultimately represents our opinions and these opinions are provided without warranty or guarantee of any kind. See full terms & conditions of service under the ‘About’ heading in the main menu.
