
We used a monthly chart like this for years while gauging the technical start of the bull market in 2016, on through several major corrective legs and rallies. We used it right into and through the massive rally that began in 2024 and blew out in Q1 of this year.
Now we use monthly HUI for another purpose. Very simply, to gauge the interim downside prior to the next bull move in this dynamic phase of the bull market. There is good news and bad news in the forecast, depending on your orientation, hopes, bias or personal/outside analysis you may follow.
While we are managing the short-term potential for a bounce (I took what will probably be a brief trade long GDXJ per the in-day notes yesterday), we are doing so within the context of a sector correction.
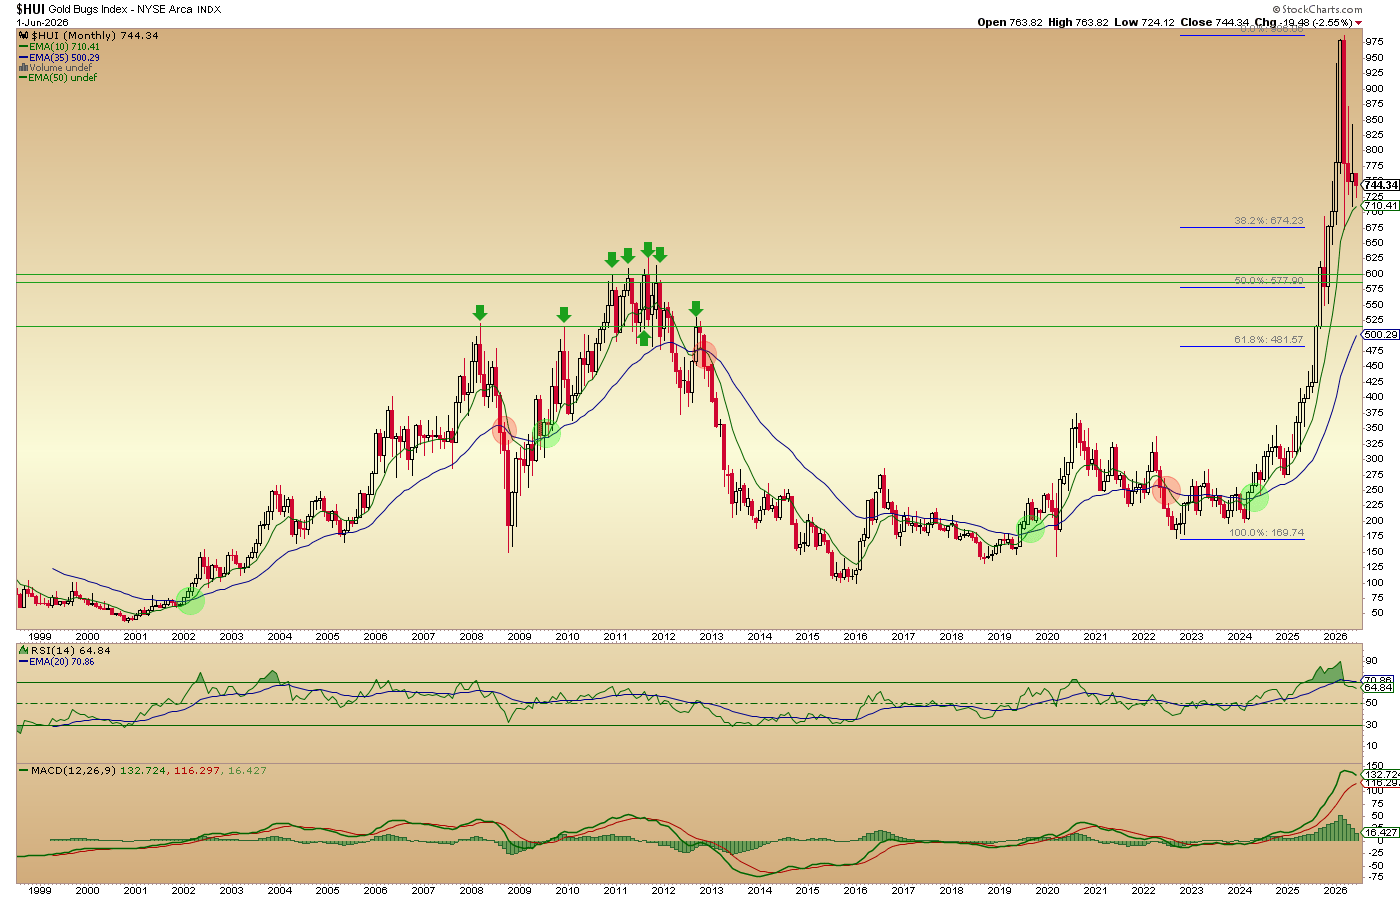
This chart is now revised to gauge the correction going forward. While gold stocks have done great corrective work thus far, I believe that Huey is more likely than not to at least make a test of the long-term breakout in the 575-600 area before the correction is all said and done. The darn thing is already half way there, and it’s been done rather painlessly for those managing effectively.
See bullets after the chart for technical and macro details of what we’ll look for going forward.
Technical
- HUI has already pulled a 38% Fibonacci retrace of the big spike.
- Massive overbought conditions are resetting, with more room to reset.
- The EMA 15 crossed above the EMA 35 in 2024, launching the bull.
- The big picture is safely in bull market status.
- A 50% retrace would test the 2011 (+/-) topping area. I expect that, eventually.
- I would not be surprised if the EMA 35 (500 and rising) is eventually tested as it was 3 times in the previous bull market.
- But for now, let’s call the best target 575-600.
- Imagine that, 575? That would have been considered a gift 1.5 years ago.
- Gold stocks are cleaning out the excessive filth of FOMOs, MOMOs and algos that humped the sector.
Macro
- The sector will be tradable (both ways) on any given interim phase. Right now, as daily charts hang around their SMA 200s, potential for a bounce of some kind is in play.
- The sector was positively aligned (as a leader) with the stock market in 2025. It probably still depends on a bullish broad market to remain intact by daily charts.
- But as we noted quite some time ago, the sector is “no longer unique”. Not at all. It will probably be vulnerable to the next market correction/bear on an interim basis before gathering itself for a future bull phase.
- I am going to lean toward the next peak in the stock market indicating the next correction leg in gold stocks.
- I am also continuing to view the extended declines in Gold/SPX and especially Gold/Oil as impairments on the next earnings season (late July-early August).
- I think sometime this summer a perhaps final leg of the correction is likely.
Broad Market
I am putting the analytical pieces together on the fly, as new info comes in and is factored. I could well be wrong because I am just one human, interpreting the details in my faulty human way. But the broad market looks like it is in the midst of manic (ending) dynamics. Although note yesterday’s NFTRH+ update showing no VIX divergence, which will not be necessary for the next correction, but would be helpful in gauging one.
I think that when the broad blows out into the next correction or bear market, gold stocks will take their final corrective leg. I believe the buying opportunity at the end of that could be epic. The trick is to be intact in order to capitalize on it.
In the meantime, if the above is on target, I will prepare to consider shorting as the main trading objective once the blowout begins. Then the easier part would be picking up the pieces from panicked sellers of not only gold stocks, but perhaps a range of sectors, commodities, stonks, etc.
This is a blueprint inspired by the updated big picture of HUI. As you may recall, we spent years following the same chart before it finally played out. I don’t expect the above analysis, if it plays out, to take so long because corrections/bear markets happen faster than rallies/bull markets. But it’s a guide. If/as updates to the big picture analysis are warranted, we’ll do that. Precious metals investors please do not overreact. It’s a sketch, subject to revisions.
