Happy Trader’s Happy Sentiment
I keep hitting you over the head with this shtick because I find it funny and because I find it useful, not as a timer, but as condition to bearish potential. Damn sad trader was so forlorn in April, he went on CNN and showed concern to the herd’s millions about Trump crashing the markets. Now that he is happy again, it means something.
His sadness contrarily called the bottom in April, and his gladness may call a top at some point. The issue being that bottoms tend to be hard and fast, while topping situations can be much more drawn out.
You can refer to the post above for stock market technical status. The anticipated new highs are in the books. As long as the bull is trending I’ll continue playing the game of musical chairs, buy the laggards, sell them when they run, buy new laggard setups (most recently per this NFTRH+ post on Friday).
Sentiment is contrary bearish, but experience tells me to just tap the breaks a bit on getting too bearish, too soon. The market is in motion… to the upside. The trends are up and sentiment is much more a condition than a timer.

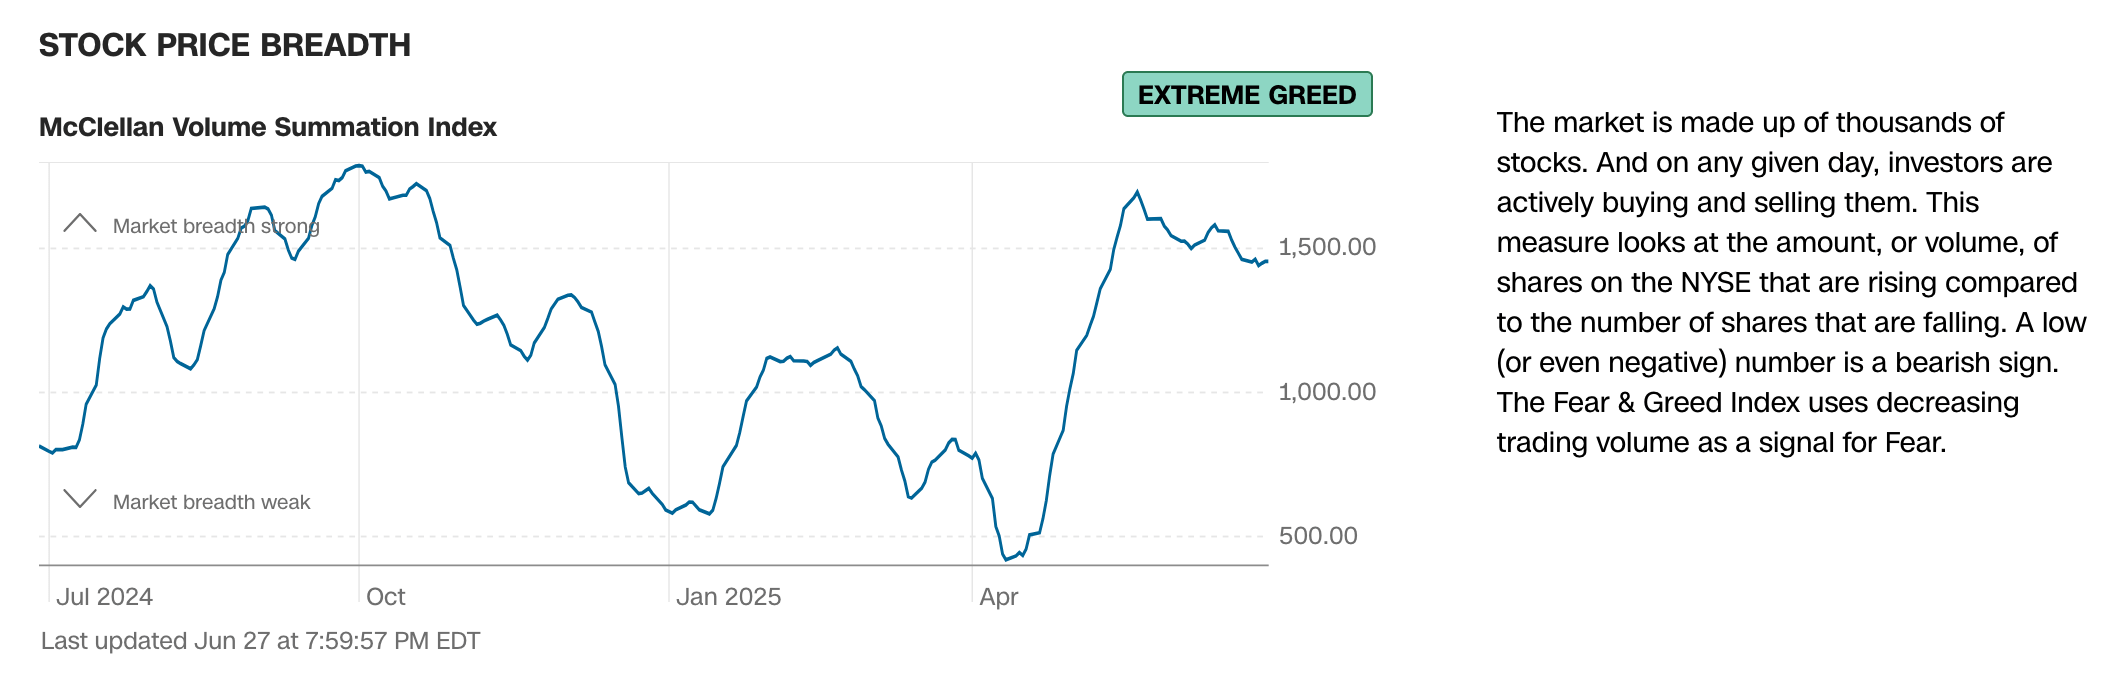
Current market sentiment, Happy Trader and the media that force-feed him to the public included, is back in Greed territory.

While not presenting all 7 components of the Fear/Greed index, the two that are most notable are the price action of the stock market (new highs) vs…

…the market’s breadth, which is negatively diverging (participation thinning). It’s not a major issue, but it is a sign of weakening momentum.
NAAIM are still futzing around over-bullish at 81%, but not extremely so. AAII is still in it mushy middle ground and not of much value right now as an indicator. To review, we’d likely wait to see a big bullish jerk by AAII in order to give bearish weight to the situation.
Market Sentiment Bottom Line
Over-bullish, not yet extreme. Not necessarily a show stopper to more stock price upside. But risk is right there alongside the bullish activity. Risk rides shotgun as markets climb higher.
Boots on the Ground: The Homies
Long time subscribers may recall that I had a boots on the ground contact in the Semiconductor industry. His info on the demand side of the Semiconductor Equipment industry was of value to our analysis, along with the no longer published Book-to-Bill ratio. Well, now come to find out NFTRH has a subscriber DT, who is a Homebuilder with some very interesting views on the current situation.
In an NFTRH+ update on Friday I noted:
Well, at least we can get this over with now. It was in the bag the whole time. Trump tore things apart so he could put them back together again. But beneath the surface, the economy will do what it will do, and what it has been doing is slowly eroding around the edges. Take a look at the housing markets, for one.
The highlighted bit caught his attention and he was kind enough to provide his (literal) boots on the ground view of the situation.
Read your note this AM; housing is actually way worse than what the data indicates. I am there at ground level, and know a lot of builders and execs from the publicly-traded side of things on both the material supply and homebuilder end of the spectrum. The larger guys are taking L’s on new developments, and have stopped providing any type of consumer rate incentives (KBH, LEN amd PHM all had emergency meetings on this 2 weeks ago). They simply can’t, because of losing some $$$ on each new build, they lose a lot more. They are also losing cheap labor left and right, because a lot of Hispanic labor is pretty much in hiding because they can’t renew anything that has to do witb work status (they have to update every 2 years). I have mixed feelings about this; I have some really good friends in the industry who are illegal, great workers (and people) and have been here 15-20 years. All in all, a giant mess.
When I requested permission to reprint, he gave the go-ahead and also sent this along:
Not at all….if you want, feel free to include this- may be a little off-color, but accurate:
Biggest issue is monthly payments relative to DTI/median income for any given area (and nationwide); if payments are too high relative to median income, buyers don’t qualify; this is the biggest problem.
Munis/counties in my area went insane with re-vals on property tax, which slows or stops development; insurance costs in NC/SC have also increased substantially, which exacerbates the PITI issue.
One thing I have noticed in Gaston Co (my chosen area of development) is that new con homes under $275k are still selling extremely well. Most of these are 1100-1300 sf. Same with existing construction renovations.
Why? Simply bc people can make the payment in that range, and the median income is a lot lower there compared to Charlotte. That number was $375-385k in 2022 before rates came up. Most projects are planned 2 years in advance, and the goal post moved. Same thing happened to me- I built with the intention of $350-400k being affordable based on median income, but now the buyers can only afford $275-300k. They won’t qualify for a loan that is any higher. Lot of other Builders and developers are having the same problem. I am lucky bc I chose not to start anything new in October, and only have 2 completed houses on the market. Some smaller- and mid-sized builders have a dozen or more incomplete houses under construction, and a dozen completed houses just sitting. That is how you go under.
So you have a bunch of new builds that are overbuilt and overpriced relative to what the consumer can actually afford. This leads to problem 2: Hispanics are no longer purchasing in the area, or anywhere else. 7 of my last 9 buyers, they believe in the American Dream (still), which I do admire regardless of political leanings (I am a centrist Republican); I have too many damn friends in construction that are just as American as you or I (brought here as small children), but are basically afraid to go to work right now. This increases labor input costs substantially, and builders are just starting to see it; I typically pay $4/sf for framing; non-Hispanics quote $8-9/hr, or more; the work is shit, with a lot of constant excuses.
We don’t have a skilled labor pool that can pick this back up if the scenario continues, from block foundations, framing, roofing, siding, insulation, drywall, painting all the way to trim work. They also do all of the trades- it is rare to see a licensed guy doing electrical, mechanical or plumbing; they all use Hispanic techs and keep the spread.
Many people just can’t deal with the work and the environment (heat and sun down here), and most of the non-Hispanic guys can’t handle it physically or mentally; the guys who can are either lacking on the skill side, or have pricing that doesn’t make any coherent sense- they charge by “feel” (shitty business model tbh). This is what we are stuck with currently: elevated costs with no demand.
I can do any construction-related task myself proficiently (I love construction) but I can’t do everything, especially when my role is GC and developer (no partners) on my projects. This is going to be a giant problem going forward that nobody outside of building sees right now.
A lot of people I know parrot what housing analysts and the NAR are saying; it kind of makes me throw up in my mouth every time I hear it- they have 0 clue what is really going on, bc they never set foot on a building site or interface with anyone they actually need to; it is dirty, dusty and dangerous on the construction site; safer to sit inside an office lol.
The analysts are saying housing should be rallying, so the big boys are buying anything from WLK, JHX to LEN, KBH and DHI; be careful on this one- Q3 earnings will be a disaster from what I am seeing. Build to Rent is the only space flourishing atm; my next 5 projects are all townhomes that will be sold to insurers (yield play). People simply can’t afford to buy in the price range in which most builders have built relative to any given area bc rates increased so sharply, and stayed elevated.
The houses in the top end of median income price range for any given area just sit, and only sell when dropped into the moved goalpost range of affordability that the Fed has managed to create (again) I have also noticed that people do not want to “trade down” into Gaston (except for Belmont/Mt Holly) bc of the reputation; can’t say I blame them, knowing what I know after working up there since 19′- it is a rough place with a lot of crime, drugs and homelessness. It is much more akin to an inner city in the Northeast, which you would not expect from a place that is considered a Charlotte suburb.
Buying picks up at 6.5% from my experience- it is like flipping a light switch; no clue when that happens. Prices will start to recover, but will lag because of all the lower-priced inventory still on the market that needs to be soaked up.
The highlighted area actually reminds me of my history as a manufacturer. For example, when the 3D Printing craze hit Wall Street (about 1.5 decades too late) I wrote about exactly why the promotion would be printing “future losses for investors”. 100% correct. I was only 2 years removed from ‘boots on the ground’ back in 2014. You can bet I take DT’s input seriously and as you probably already know, I take the suits on Wall Street with a grain of salt, at best. And as a blight on a productive economy, at worst.
So the above is real information from a real Homie in a certain US region. But he also speaks about the national situation. I’ll keep the politics out of it and simply take note of the cost and inefficiency of the new labor base. Supply, demand and politically altered demographics are serving to pressure home prices downward as costs rise.
It fits with my thesis that we are not going to march in a straight line to the inflationary heavens. The big macro view has been and continues to be that multiple creeping pressures on the economy will cap inflationary indications and grind down economic activity (both are already happening) with the result being disinflationary signaling before the next inflation phase.
Right now we are on the “Silver/Gold ratio trade”. When it ends, I expect disinflation to at least temporarily snowball into market/economic liquidity concerns, at best. An outright liquidation at worst. The main point is that the “tardy Fed” needs a lever in order to re-inflate. Fears of deflation have always been that lever, successfully pulled in service to…
…new inflationary phases that have served to pressure the middle and poorer classes (paychecks not rising in line with costs caused by inflation) and further enrich the upper/investment classes (driving up the prices of their stocks, their art, their belongings, and most of all… their real estate!
Here again is the road map to a tardy Fed’s typical path. The message of the last two real bear markets is that when the Fed finally starts cutting, the markets and economy are going into the tank. In other words, be careful what you wish for Trump.

81% of CME traders see no cut in July, but 75% see a .25% cut in September. In my opinion, the next rate cut will coincide with the beginning of an increasingly obvious recession.
The New Macro
“But it’s different this time” say the herds. But also says the Continuum, this time. I just don’t think it will be different in the positive way the herds may wish.
I bludgeon you with this chart. I know that. But I do it for reasons:
- I for one am a visual rather than intellectual learner. I need pictures. I need to see things rather than read things.
- I’ve found the message of this macro picture to be profound.
- First it was very useful in keeping us grounded for many years, tuning out inflationists (most notably Bond King Bill Gross shorting the long bond and blathering about inflation in the 2011 hysteria) as long as the Continuum held below its limiting moving averages. The long-term trend was down in yields and thus disinflationary in their macro signals.
- Second, the “profound” aspect really kicked in in 2022 as something that had been for decades, no longer was.
After the Continuum was broken to the upside (big picture inflationary macro signaling replacing long-term disinflationary macro signaling) our job became interpretation of this profound change in the macro. My interpretation follows the chart.

- Multi-decade downward trend in the yield (disinflationary signaling) permitted all manner of Fed and government policy creating more inflation.
- Inflated (printed) dollars were inefficiently funneled into the economy, raising asset prices and keeping the impression of a strong economy (and the associated long-term bubble) intact.
- The whole while the bond market’s signal (as opposed to reality) was “see, no inflation here!”, allowing policymakers free license to inflate again and again, as needed.
- Then 2022 happened. The disinflationary signaling trend was ruptured and I strongly doubt that Genie is going back in the bottle, even with a widespread macro liquidation.
- Any liquidity problems out ahead would be seen as interim to the next inflationary phase. We’d look for the Continuum’s former upside limiters (red, resistance) to now roughly be seen as support (in the new macro). But a decline in the yield from the current 4.8% to 3.3% to 3.6% could be enough to get people thinking “business as usual” as the Fed springs back into action as it had for previous decades.
- But this is not the near 0% of 2020 or the 2% of previous yield downside during the former bond market bull. This would be a deflationary whiff or scare, jerking the Fed back into inflationary action.
- But instead of a bond bull (declining yields), this is a bond bear (rising yields) on the larger trend.
- With the structure of the bond market’s post-2020 reaction, we would probably be looking for the next leg higher in bond yields after Fed and government respond to the next recession in a “business as usual” manner to the previous decades.
If this interpretation is correct, it would be an economically corrosive inflation event. In other words, the next inflation phase would be Stagflationary. And in a world at war and societies at each others’ throats, critical asset grabs could drive up certain key and even critical commodities and resources, as risk-off would no longer mean “buy bonds” as it had for previous decades. This could be the death of the traditional 60/40 (stonks/bonds) herds out there.
But first, the trigger or better yet, the lever. A bear market or bear phase and liquidity problems to jerk our policy heroes into inflationary action. That is the current operating plan.
Bottom Line
Expecting disinflation, recession, to possible deflation scare in the interim. Later, if/when Fed and government respond in a “business-as-usual” manner, cheered by a public (and president) largely ignorant of the corrosive effects of these monetary/fiscal operations, we will find out that what worked so swimmingly circa 2001-2020, no longer will.
They will attempt a bailout, but the results are not likely to be in line with expectations per the 2001-2022 phase. I expect a “next inflation”, but not a relatively friendly inflation as per 2001-2020.
Precious Metals
Gold got cracked hard last week after we had noted its clearly waning momentum (and negative RSI divergence) last week in #858. Imagine that, cracked all the way down to 3273. While I am bullish on gold’s big picture (see 2nd chart below), I would look for a test of 3200 at least, if not a more significant event to 3000.

Gold vs. SPX? Bubble you say? Have patience, gold is just fine. Another picture that I find myself retreating to whenever the noise gets too loud out there. Imagine gold above 3000 and it’s still merely working on its base in relation to the stock market. Where’s the bubble? Policy? Economy? Stonks? All of the above? It ain’t in gold.

From an NFTRH+ update on Friday:
I’ll sit with my gold, no problem, as usual. But the question now is whether the gold miners will tag along with the SGR trades (nominal silver is making a nasty little pattern this morning), assuming they keep going? That is what happened in 2005-2008. But I believe we are on a much more compact time frame today.
The pattern looks unpleasant, but note the word “little”. Taking it at face value, its measurement would imply a drop to test the uptrending SMA 50 and support at the pattern top only. Hence, buying opportunity if it comes about.

Meanwhile, as per Friday’s In-Week Notes:
2: W/ respect to what is written below [in Friday’s notes], here is the curiously firm Silver/Gold ratio.

I am willing to continue on with the Silver/Gold ratio trades in commodities as long as this signal holds up. If silver acts as it usually does, it’s probably got one more surge relative to gold left in it. This could also boost the gold miners, which are no strangers to rallying with the wider commodity trades.
As noted in Friday’s notes, I’d seen enough – especially with that big up day on Thursday and then these goons in the news on Friday – to limit a couple losses and take some profits (whole and/or partial positions). US/CHINA. WAS. IN. THE. BAG.

GDX popped, filled a gap and dropped and left another one. It is currently testing the SMA 50. But if silver were to drop to test its SMA 50 and pattern top, might GDX lose the SMA 50 (possibly after a bounce to fill Friday’s gap)? It might. If it were to do that the next key level appears to be where another gap resides above support at 46. If GDX bounces to fill the gap, I may reestablish a hedge. If GDX promptly loses the SMA 50, I may reestablish a hedge.
But having less positioning, hedging is not a high priority and I am looking to be a buyer (perhaps one last time for the cycle) as the more important objective. This assumes the Silver/Gold ratio continues to elevate as I believe we are late stage and in an at least temporarily degrading macro-fundamental backdrop for gold and gold mining.

While this is all just a sketch of one possibility that looks quite doable to me, it could actually build in a better outcome than I had previously expected. Not necessarily targeting higher than our operating target for HUI (500), but potentially extending the process, time-wise.
Could Huey actually have another August high in its future? It could. But to extend the time, a deeper short-term correction could provide the fuel. The support at 370 roughly coincides with the deeper correction scenario to around 46 on the GDX chart above. If silver is testing the top of its pattern at 34.50 at such time, so much the better.

Commodities
Running late today. I’ll have to step it up and close the report promptly.
With the Silver/Gold ratio still functional in its bounce/rally, I am still functional on commodities and commodity related stocks. Assuming that status, the Commodity ETF (DBC) could be a good buy at or just above the converged moving averages.

Using Palladium as an example of a would-be buying opportunity, here is what I’d ideally like to see for a re-buy. A pullback to 94.50 may not be realistic, but a gap fill at 97.50 could be.

I hold COPX, but by way of another example, a drop to 42.70 to fill the gap could be a place to buy or add. Again, we’re assuming the SGR continues upward.

Well oil bulls, here’s your opportunity. Assuming you tuned out the super-cycle and peak oil dorks on the recent hype.

I think that US Rare Earths play MP, which pumped on some big shop’s upgrade, and dumped after US and China made nice-nice, could be a buy-back at 28-29.

I am just holding the holder (of Uranium). Macro willing, this breakout could have further to go.

Portfolio
Gold is long-term risk management & monetary value/stability in a balanced portfolio.
Taxable Account
In order of position size. Probably mostly set with “bull stocks”, but would look to added commodity related items and gold stocks, after correction plays out.

The taxable account carries very high cash levels as long as cash and equivalents are paying out. This is considered a savings account of sorts, rather than a speculation or even investment vehicle. The goal is to speculate around the periphery of that. In another market phase (e.g. post-crash), the account may get much more in the game.
Trading Account
No positions. This is where I’d like to nimbly short individual equities when I start to feel the broad rally is concluding.
Roth IRA (non-taxable, no contributions)
The chart tells me “don’t be greedy”. So I won’t. But I think it can take one more leg higher, pending the Silver/Gold ratio.

Cash is 78% and holdings are diversified between gold stocks, commodity related stocks and regular “bull” stonks. I’d like to gear in to one more leg of the rally, but I’ll let the market decide. I feel no pressure about much of anything right now.

Cash & income-generating Equivalents are at levels that are right for me and my real-world situation. Your situation is different. Cash will be adjusted as needed.
Refer to the Trade Log under the NFTRH Premium menu at nftrh.com for trade info, if interested (not that you necessarily should be). Also, you can follow on X @NFTRHgt for notice of updates.
NFTRH is not to be distributed to third parties without prior written consent
Notes From the Rabbit Hole (NFTRH) is a weekly market report in which we provide analysis on financial markets. We make every effort to provide accurate and high quality content, but this analysis ultimately represents our opinions and these opinions are provided without warranty or guarantee of any kind. See full terms & conditions of service under the ‘About’ heading in the main menu.