[edit] On a quick look, Soybeans appear to be in a similar low risk setup. I am going to look into it further, and SOYB may also be added if I like what I see. [edit 2] SOYB added.
The trade log noted that the ETF, CORN was added, and this update explains why (despite my obvious lack of expertise in, and my usual lack of interest in, the Ag market).
The Chart
There were positive divergences by daily RSI and MACD into the August low. Corn then burst upward, consolidated and held the SMA 50, and is up with everything else today, clearly taking out resistance, which it will try to turn to support. That support can also be used as a caution/tolerance point by a would-be buyer.
This is a chart of the commodity, not the ETF, which has not yet achieved a base breakout.

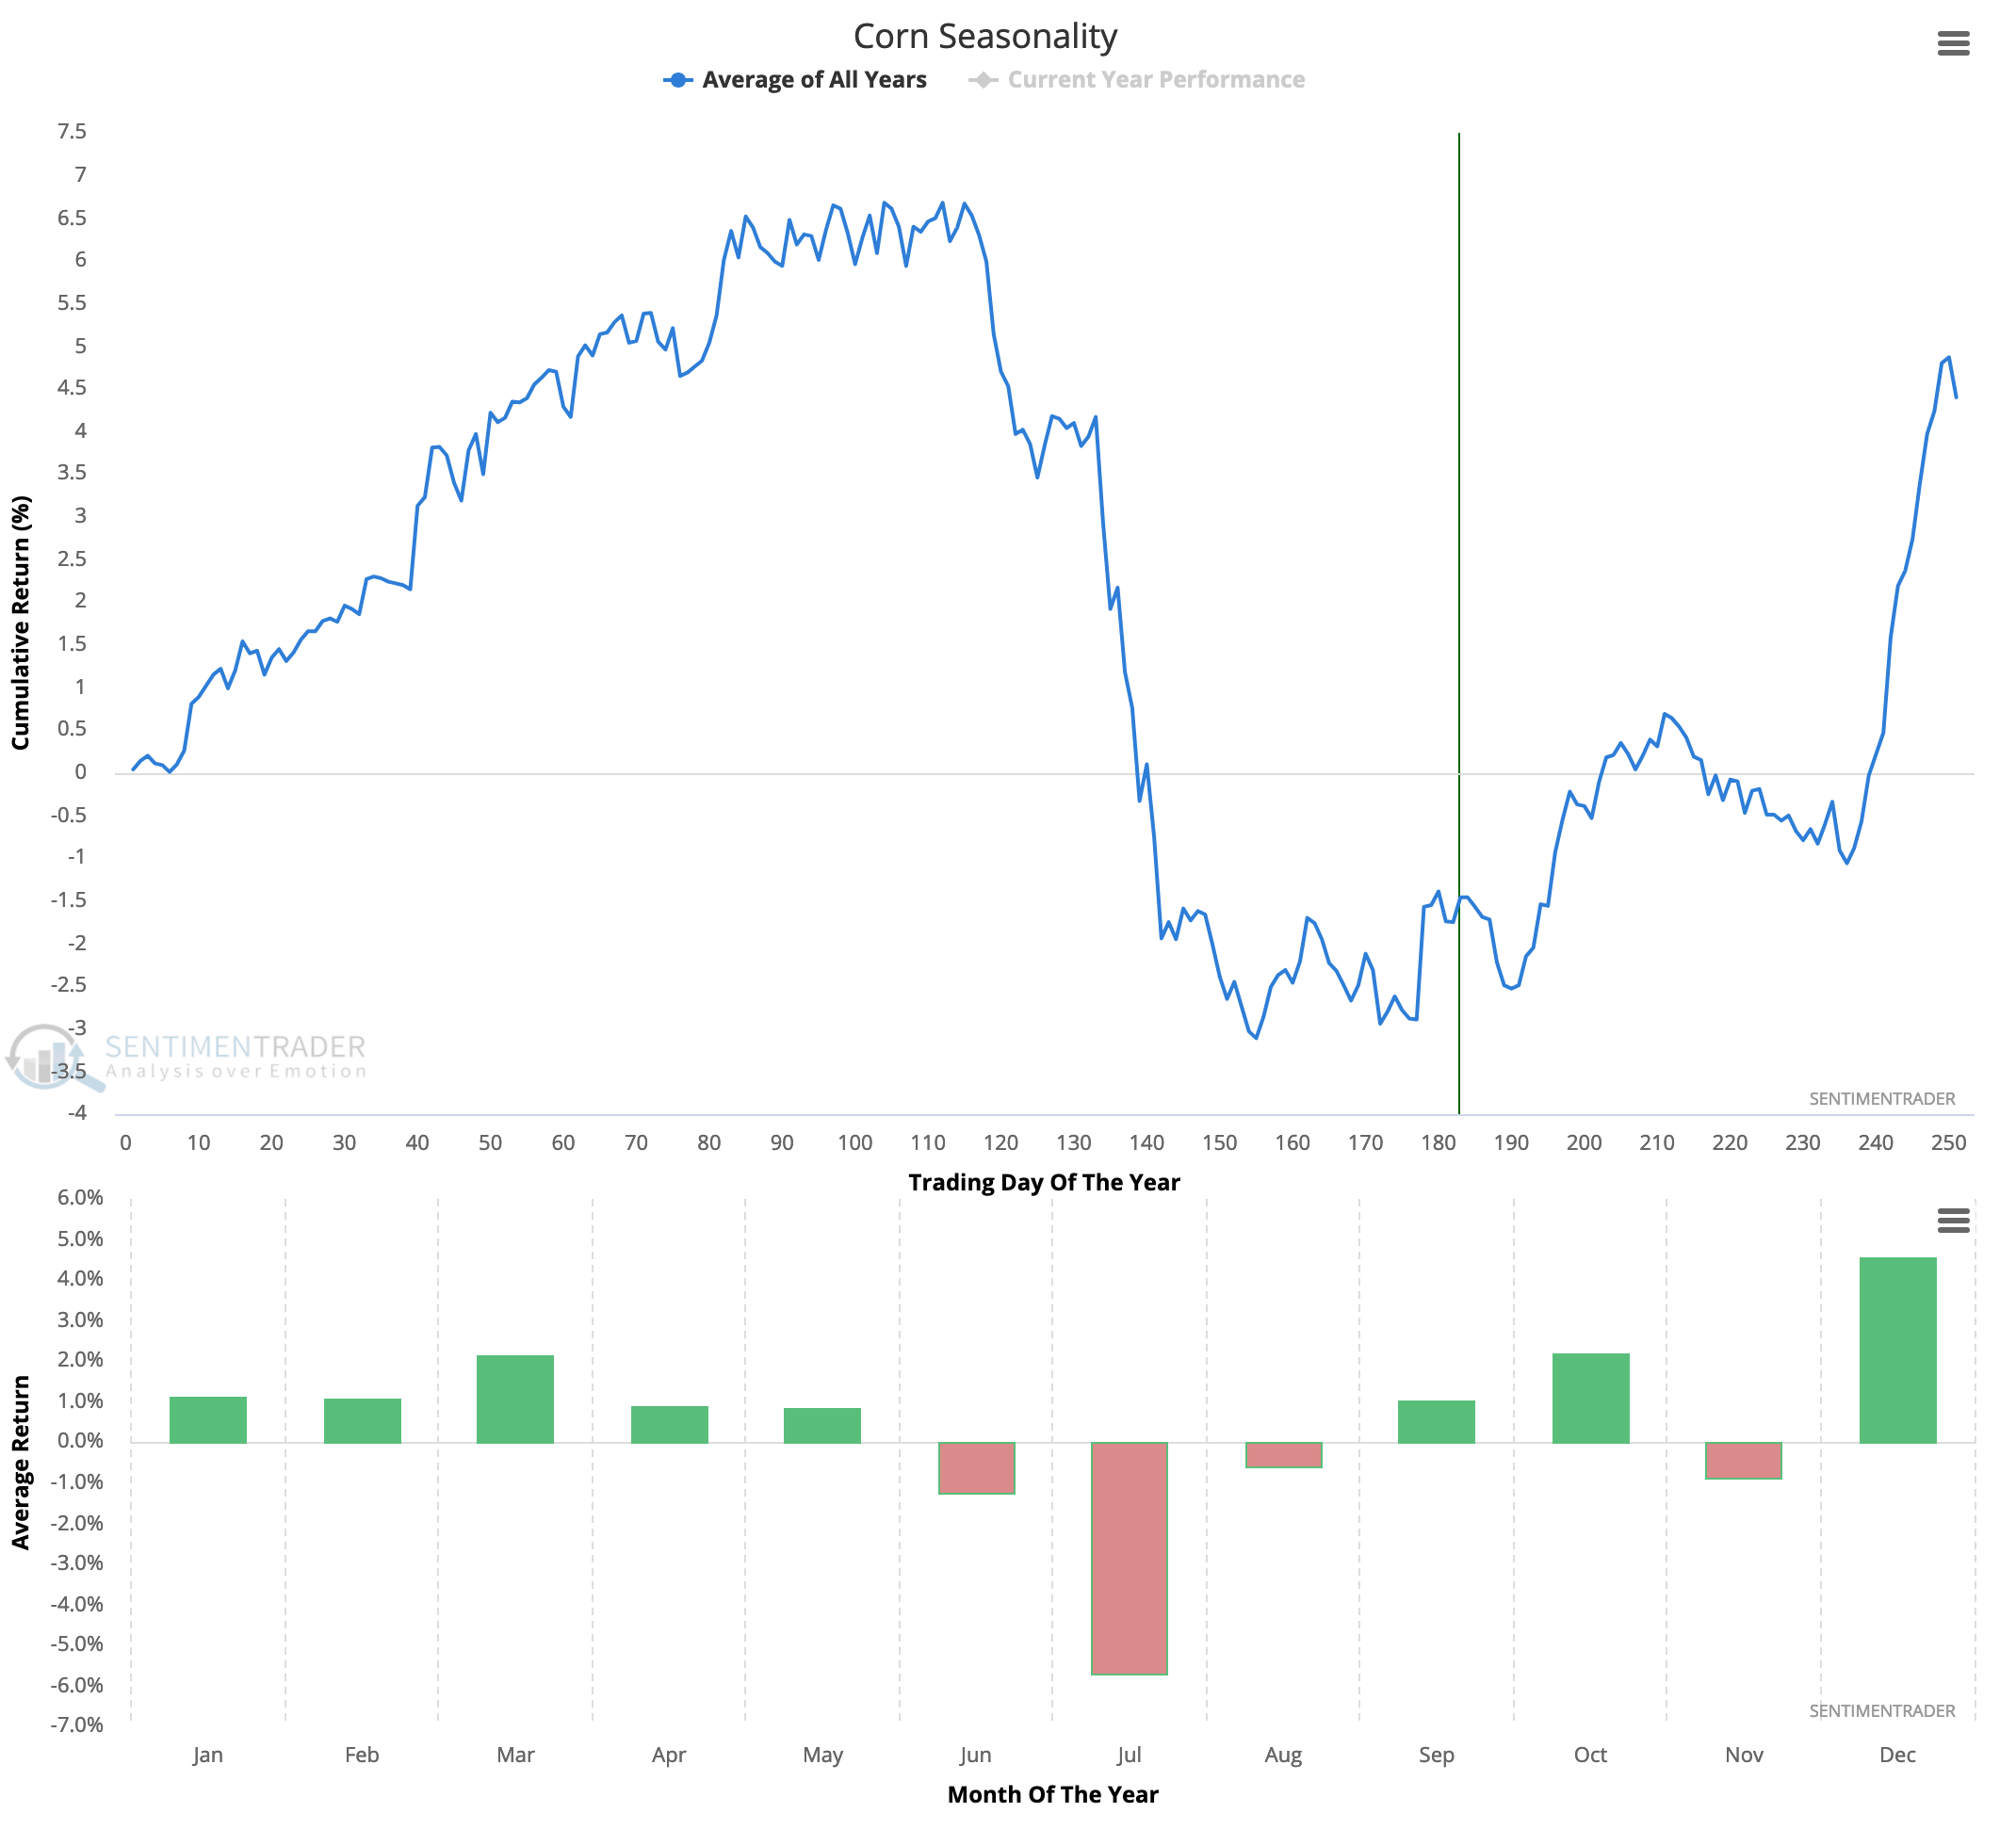
The Seasonal
The seasonal turns up around now, on average. Indeed, I like that the commodity price declined right into the average seasonal low in July-August. If the seasonal keeps working, it’s theoretically up from here until next spring.
The Hedgers (sentiment)
Hedgers have only recently begun to turn down from an extreme in net long positioning. That positioning was was due to the long downtrend from the 2022 high. This is a contrarian bullish structure.

To my eye that is a triple dose of positive inputs that paint a low risk picture, considering how long the commodity has been in a correction.
A reminder that chart based NFTRH+ updates are technical trade setup ideas, which may not be revisited as the technical parameters are already noted. These updates are meant as a starting point for your further research if interested. I will not personally buy every item highlighted and will sometimes sell (ref. Trade Log) any item that I do buy below target (assuming I’ve not stopped out or sold for some other reason) as I often do. Also please be aware that I am not a fundamental stock analyst. Due diligence is your responsibility.