
US Stock Market: Major indexes broke through resistance and SMA 50, in a move flashing ‘BULL’. One last hope for bears is that wave ‘B’ will stop below the previous high with a coming ‘C’ correction down to target (generally 200 day averages).
US Market Sentiment: Mixed bag but still biased contrary bearish.
Market Indicators: Those that have been sleepy remain sleepy. Those indicating danger are still active, but slow moving. The sleepy guys will wake up one day and that is the day the danger guys get to work. Market risk is high.
Global Markets: See segment for individual markets. Prime watch item is Emerging Markets along with ex-Japan Asia.
Precious Metals: The daily Symmetrical Triangle on GDX broke upward, as TA theory said it should. Silver had smashed upward out of its bull pattern (ref. weekly chart), smashed back down to test the breakout and may be back on the bull. Gold, in its usual less excitable way, is also quite bullish technically, and may seek to take out the recent high and go to or through our target of 2450. Still looking for a ping through the downtrend channels in both HUI and GDX.
As to whether they would be ‘sells’ at that point, such things are up to individuals. I believe it is already a bull market. Investors may hold. Others may wish to confirm the next leg of the bull before holding too much for too long. Personally, in my decision making a lot is going to depend on the state of the macro at any given time. Right now, it continues to grind favorable for gold over cyclicals and one day should provide bull leverage for the gold mining industry.
Commodities: See segment for the Whack-a-Mole sector. “Commodities” are not just one thing. The components have different technical, supply/demand and end user dynamics.
Currencies: USD is still moderately bullish on the daily chart. The daily will direct the weekly and monthly, which each show an ongoing bull market. Fundamentally, if the Fed weakens again an important backing would be removed from the buck. However, a dovish Fed could mean a weakening economy and markets, which could also mean an oncoming liquidity crisis, as USD would gain that bid. That is potentially far out in Q4 or Q1 ’25.
Bull
From NFTRH 808:
This pig never did even pull a 38% Fib retrace on the pullback and is compromising the A-B-C correction view by ticking above the previous high. What’s more, the looks of RSI and MACD look sneaky to the bull side. So if indeed, it is ‘party on’ on Fed relief, so be it. Meanwhile, SPX still resides at the SMA 50 and resistance, so I am not giving up the short position yet.
I gave up the short position as SPX took out resistance, turning it to support. While this compromises the correction view, it does not kill it. The last technical man standing between here and a resumed bull party is not to make a higher high above the March 28 high of 5265.

An A-B-C correction often features a weaker ‘B’ wave that fails well short of the previous high. Our specimen above shows it stronger and testing the top. However, while I am not an EW technician, the general rule is that ‘B’ not rise above the March 28th high of 5265. ‘B’ waves are thought to often unfold in 3 sub-waves, and you can see clearly that ‘B’ above has done that.
While it appears the bulls have taken the bears’ lunch money and will chase them around the playground giving wedgies, there remains a glimmer of hope for the bear case. A wave ‘B’ has unfolded in 3 waves and is still below the previous high.
Stock marketeering is not a business in which you should have a big ego. I am often wrong, but it is when I correct those wrongs decisively that I avoid catastrophic events. Sure, I get shaken out of good positions as well with this type of tight risk management, but I’ve avoided a lot more damage than the sum of missed profits.
Bottom Line
SPX took back key milestones to set itself free to resume bulling. If it does, the sky’s the limit, with “sky” being whatever heights a combined fiscal (government) and monetary (Fed) policy tag team can pump it.
But SPX is not quite out of the woods, below the 3/28 high. A failure (or even a tick higher and bull trap reversal) would reload our downside target at the rising SMA 200 (4720).
Let’s assign similar status to big Tech (NDX), and also note the ongoing negative Dow Theory divergence for the Ascot and Cognac crowd. However, let’s also consider another bullish option:
The Semiconductor index may have already completed an A-B-C correction and this is our confirmed leader in the US markets. Hence, Captain Obvious would ask you to watch the Semis for guidance!

US Stock Market Sentiment
Smart money indicators are fading the market while Dumb money eats it. Risk is high and sentiment is aligned as a condition (not a directive) for the bearish options above.

NAAIM: Investment Managers were also eating stocks as of May 8th. They likely ate more as prices continued rising. Weak inflation and economic data have apparently stimulated those Goldilocks feelings among market participants.

Investors Intelligence: As of May 7, Newsletters were still retrenched from previously briskly over-bullish sentiment. This was a positive contrary backing for the rally that sprung last week. II tend to be more ‘sticky’ and less flitty than the likes of NAAIM or AAII. They’d probably increased bullish sentiment by week’s end, but the last reading is contrary bullish.
AAII: Ma & Pa were deeply retrenched to a bearish (contrary bullish) view as of May 9. This too is permissive of the bull case.
Sentiment Bottom Line
The market sentiment picture is mixed. But dates of data harvesting come into play here. Overall, I would say market sentiment is not healthy (contrary wise) but also not a show stopper if the bull starts to rampage. Folks, we are operating within a giant long-term bubble, after all. Wonderland, where anything is possible. The bubble is confidence. Confidence does not break easily.
Global Stock Markets
Global (ex-US): ACWX busted a new high for the cycle although unlike the US, it never did make an all-time high above the 2021 high. Global appears to be playing some catch-up. It may be viewed as both a positive divergence to US stocks on the short-term and a negative one on the long-term.
Europe: STOXX 600 has also ticked a new high for the cycle, but is also at an all-time high. Global gettin’ bullish, eh?
UK: UK 100 has gone from the market we viewed as most buyable within its bullish pattern with as yet modest price performance to an index in upside blow off mode that is quite overbought on daily and weekly time frames, although technically targeting much higher levels over time (current price: 8433, upside measurement: 10,900). I don’t invent ’em. I just measure and read ’em.
Canada Senior: TSX barely ticked an all-time high before easing back below it on Friday. Bullish, obviously.
Canada Junior: After taking out target #1 at 580 TSX-V poked above the next target at resistance (595) and faded in-day to start testing that. The next target is the gap at 622.

Meanwhile, our ratio of the two continues to sport a base and potential bottom. A bullish resolution here could put some thrust into the more speculative ends of the commodity, resources and precious metals trades, assuming silver continues leading gold, which it probably would if this plays out bullish.

Australia: AORD is below its recent high but above its major high from 2021. It’s a bull market and if the global bull continues, there’s no reason AORD will not continue. Especially if the commodity/resources trades perk up.
Japan: NIKK took a hard crack in April and is rising in what looks like a daily chart bear flag. “Looks like” and “is” are two different things. I’ll have little interest unless it gets a harder correction. Regardless, over the long-term the Nikkei much more often than not tracks the inverse of the Yen, and since 2022 they have been in lockstep. The implication continues to be ‘currency in the dumps, stock market in the penthouse’.

LatAm: BVSP continues to establish an intermediate downtrend as the daily SMA 50 trends down and the price is below it. But a wider angle view of BVSP shows a bullish looking base and potential bottom situation. If it were to break the downtrend channel on this weekly chart it will have also taken out the 50 and 200 day moving averages on a daily chart. Something for LatAm bulls to be aware of. Meanwhile, the LatAm 40 (ILF) has taken out its daily chart moving averages and is technically bullish.

China large caps, A-Shares, Asia & EM: FXI is still motoring upward but has not yet exceeded the July 2023 high that would trigger a larger bull view. However, daily charts lead and this one is trying to break the downtrend. Asia (ex-Japan) has taken out that high but not the January ’23 high while EEM has taken them both out and is on a bullish breakout. This has my attention, and if the US dollar fails its rally EM could be a go-to area.
India: BSE Sensex took a hard crack down below the daily SMA 50, within a still intact bullish structure. With RSI negatively diverging, it’s not a picture I’d want to buy. But it is firmly in its bigger picture bull trend.
Frontier Markets: FM is in a grinding cyclical bull market from the 2022 low. It is far behind the developed markets, but the way that bull markets play out, speculative areas like this could play some catch-up into the bull’s end.
Precious Metals
Symmetrical Triangle on the GDX daily chart did what it was supposed to do.* It broke upward as a continuation pattern.

* In other words, the odds favored an upside breakout as opposed to a downside one. TA rules do get broken with more frequency than the average TA might like to think.
The target is 40 (+/-) and a gap fill. Such an event would obviously break the channel line.

But monthly HUI again instructs that monthly candles have tended to surge upward before reversing in-month. So we will be aware of that if GDX goes for the gap and breaks its channel. We could hit target, get the gap taken care of and then pull back.

That is certainly not a prediction because I believe the next leg of the bull market is fomenting, either sooner or later (Q4 or H1, 2025). There is no assurance that my gap fill and pullback theory is anything more than a viable scenario. The sector has been making a healthy correction since 2020, after all. That is in service to the next strong bull run.
So taking it a step at a time, the next step is to see if we can register the targets and then we’ll evaluate. If GDX and HUI were to take out and hold a break out of the downtrend channels the next leg of the bull would be on. Let’s not over complicate it. We’ll evaluate signals in the macro market along the way. As of now, they are in progress.
The combination of a weak Gold/Silver ratio (daily charts) and generally firm Gold/Commodity ratios is bullish for the gold mining sector. Especially the Gold/Oil ratio. Gold/Stock markets has a look of potential trend changes. That will be important. Gold/Copper is weak, but as belabored, is not broken and still in an uptrend from 2021.

As to the Gold/Stocks macro consideration, Gold/SPX is a ratio between an honest monetary anchor and the headline index of a nation addicted to paper asset appreciation and debt paper obligations; Bubblenomics. The mighty S&P 500 is the very emblem of that great bubble. However, gold continues to rise in relation to lesser reaches of the stock market world, outperforming the Value Line Geo index and Small Caps since 2021.


Gold is doing the expected in comparison to ‘Inflation Expectations’ ETF and the gold miners have made a catch-up move to the indicator since we first identified the positive divergence for the miners a few months ago.

BPGDM remains overbought and the likes of it and the contrary negative bias to the Commitments of Traders data should be considered, but not overreacted to. That is because after 3+ years of ignominy (the correction leg from mid-2020) the sentiment fuel built up could persist. In other words, these overbought/over bullish readings are features of a bull market. There are certainly enough animal spirits in play to potentially drive GDX/HUI to target before the next correction.

The HUI/Gold ratio is still trending down but in holding its constructive status above the 200 day moving average, it is a signal that the gold miner rally is not done yet. For example, had the HGR failed while GDX worked its way through the Symmetrical Triangle we’d have had a higher level of caution on the rally.

Friday’s public article outlined gold’s performance vs. several markets, but did not include currencies. Here is the updated daily chart of gold bulling in all major global currencies. Gold/Currency ratios here may be turning up after a healthy pullback. The old story goes that a real gold bull market will see gold rising vs. all of them. Obviously bullish vs. USD, that is what is in play now.

Nominal gold’s daily chart is similar. A real bull market will make sharp pullbacks to clear overbought situations and often not pull back far enough to ‘no brainer’ buy territory. That appears to be what gold has done as it starts to turn back up from a fairly decent pullback that relieved overbought RSI. If the correction is over gold will probably smash our initial target of 2450. It’s got the technical fuel for it, at least.

Silver works best by weekly chart these days. We began managing the bullish pattern and the target of 35 back in 2023 and damn did it take a long time to prove out. There was a breakout, a classic retest of the breakout and last week, a new surge upward. This can only be described as technically bullish. Especially with much higher upside thrust volume than the pullback/test volume.

Finally, I want to keep an eye on the Canadian TSX-V index, because as it rallies it is a tailwind to my little fellers on da ‘V’. I have replaced NFGC, a stock I do not have major conviction on with my intended long-term hold, AE.V in the bottom panel. That one will probably go its own way with that way being dictated by drilling results over the coming months/years. The others are varying forms of bullish, from moderately (AMX.V & MAI.V) to strongly (OGN.V & RIO.V). Meanwhile, we can watch to see if TSX-V can make a try for its gap at 622.

Commodities
GNX daily looks like a bear flag creeping up the SMA 50.

GNX weekly is fanning along a potential base as it tries to bottom. Support at 560 above is shown here as well. That will be an important marker as it turns down from the most recent fan line.

On the daily chart below Crude Oil is a drag on the indexes as it bear flags below the daily moving averages. Nat Gas is on the seasonal rally (seasonally bullish on average into June and then after a pullback into July, is bullish again for a long haul into year end. That’s an average, not a directive in any given year. Nice tailwind though. The Energy sector as a whole has been stair stepping in a corrective manner. It is trying to hold the SMA 50 here. If it fails, another step lower would be indicated.
Doctor Copper is still bullish, obviously. Doc’s industrial bros are bullish while making a sideways consolidation. Copper miners continue to bull as well.

The Uranium sector is holding serve as it consolidates its gains. I have replaced Uranium/REE play UUUU with the Sprott Physical Uranium Trust, SRUUF, since it was added last week. I keep a close eye on the sector and am careful about not holding too much of it because it has been a long run and the Uranium price has gone a long way. So I will continue not to allow any technical breaks while still holding. An example was NXE, which did some fancy debenture deal for physical u3o8 that I did not fully understand. I sold it on Wednesday after that news and then it cracked on Friday.

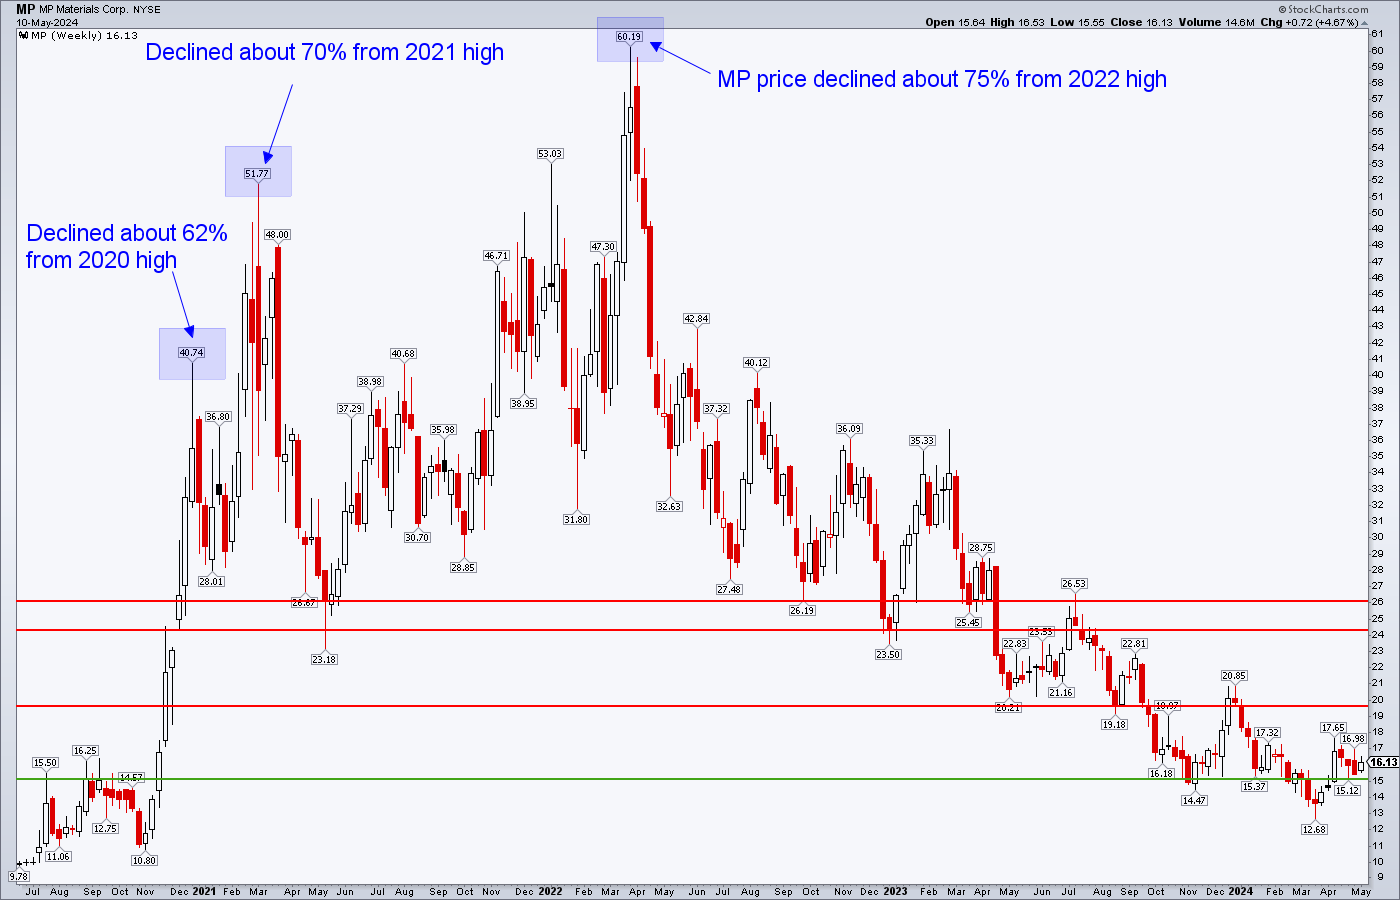
The Rare Earths sector may or may not be bottoming (the trend remains down). But I hold US based REE MP Materials for the reasons often stated: 1) it is a strategic US producer in an increasingly adversarial world and 2) as this chart explains, the stock price has declined much further than the average Rare Earth Element, the prices for which are well above their 2020 prices. So I try to be holding it whenever it looks even possible for a bottom.
The Agricultural sector (GKX) is attempting a bottom of its own. It is worth noting the seasonal averages for some of the individual items (remember, even for a sector that is more distinctly seasonal like the Ags, a deviation from the norm can, and usually to some degree will, happen in any given year:
- Corn has been rallying in line with its seasonal, which tops now.
- Oats seasonal is sideways/down into August, when a hard upturn happens.
- Soybeans have been seasonally positive since October and are due to top in July.
- Sugar bottoms in May/June and bulls for the remainder of the year. This one (CANE) might be worth a look because the price chart is actually in line with the seasonal, having declined to this point.
- Wheat turns up on average (much as its price has done) into May, turns down hard and bottoms in June, then turning up into year end. It is also one to watch if the current rally holds to script, tops, and declines into June.
- I am putting Sugar (CANE) and Wheat (WEAT) on future watch.

As a side note to the above, the two ‘Fert’ items I watch, NTR and MOS have zoomed upward and tanked downward respectively, both on earnings. That bears some looking into as to who is rightly forecasting the market. The Ferts are another way to position in an Ag related sector.
Platinum got bid hard, holding the lows we noted it needed to hold to avoid a breakdown. As such it holds its potential bottom/base stance, as does Palladium, which has really gone nowhere of note. Platinum looks closer to breaking its downtrend than Palladium. Regardless, I am still holding PGM producer SBSW as it holds the basing situation per the original NFTRH+ update on 4/29.

US Dollar Index
I want to remind you that despite legions chanting repeatedly about global dedollarization, BRICS selling USD/US Treasuries/buying of gold, and all the Utopian reasons why the great hegemon may be dead, the technicals instruct that said hegemon is alive and well. At least in its potential to crush you if/when the time comes for a global liquidity crisis, which could be the lone driver left for USD if the Fed does stand down and roll over dovish.
USD is technically bullish on all time frames, with RSI and MACD positive on those time frames. Daily USD has been rallying for all of 2024 and has pulled back of late but held support. If a change in status from bullish to bearish will be in play it will start here on the daily chart. As yet, Uncle Buck is intact.

The weekly chart shows that the hard correction off of the hysterical ‘hawkish Fed!’ phase in 2022 found support right at the 62% Fib retrace and corresponding long-term support. Again, RSI and MACD are green.

Monthly USD once again advises that clear and solid long-term support has been held thus far with USD in a bull market that began with the higher low in 2011. These are simply technical facts, leaving aside the idealistic dreams of a world free of Uncle Buck’s tyranny.

My personal view continues to be this: Idealists and Utopians are out there with bull horns, hopes, chants of “dedollarization” and maybe even an Uncle Buck voodoo doll or two. That will all get swept away in the next liquidity crisis, whenever it arrives as the world lunges for US dollars, ideals be damned.
Sorry to sound harsh dear DoD (Death of the Dollar Cult), but in my experience it has now been 2.4 decades of this, and while the profound change in the 30yr Treasury yield Continuum (below) could well forecast a very negative change for the US dollar over time, until the world is fully disengaged from the hegemon, the world will buy dollars in panic at the next market liquidity crisis.
My view. Yours may differ.

Portfolio
Funds are balanced by gold (long-term risk management & monetary stability).
Holding Au/Cu explorer AE.V in a separate account. It’s a long-term position with little temptation as yet to take short-term profit despite a hearty paper gain of 32%.
Roth IRA (non-taxable, no contributions)
Cash (and equiv) is 85%. Favored gold stock positions are held, including my little fellers on the TSX-V. I hold a couple Tech bottom feeds and the beaten down but strategic MP, along with SBSW, bought at is bottoming/base.
Until this market either reclaims the bull rally or starts to resume a correction (a real one this time, please) to the SMA 200, I’ll happy manage risk while collecting income. One day I could envision being short the US stock market, long the gold miners and simply loving life. But for now, it’s a little boring, quite conservative and just the way I like it when the Fed has been forced to pay me a decent income for my boredom. This is a marathon, not a sprint (unless you’re a daytrader).

Cash & income-paying Equivalents are at levels that are right for me and my real-world situation. Your situation is different. Cash will be adjusted as needed.
Refer to the Trade Log under the NFTRH Premium menu at nftrh.com for trade info, if interested (not that you necessarily should be). Also, you can follow at Twitter @NFTRHgt for notice of updates.
NFTRH is not to be distributed to third parties without prior written consent
Notes From the Rabbit Hole (NFTRH) is a weekly market report in which we provide analysis on financial markets. We make every effort to provide accurate and high quality content, but this analysis ultimately represents our opinions and these opinions are provided without warranty or guarantee of any kind. See full terms & conditions of service under the ‘About’ heading in the main menu.
The rally is on shrinking volume. It may run out of demand ?
Well, this pig has risen in the face of other even more pronounced technical/internal negatives. So I guess we will see.