

Summary
US Stock Market: Now that the rotational sectors (cyclicals, materials, energy) that had previously supported broad SPX are weakening or had a sharp reversal on Friday, it is time to consider the prospect of a market correction. Possibly the theorized hard correction that would renew the bull later in the year for a hard run into Q4.

US Market Sentiment: A sharp pullback in sentiment, indicates the possibility of a bounce, short-term. However, we can also watch for sentiment to continue to degrade, which would kick off the search for a sentiment low prior to the theoretical rally into Q4 per the above. Here you can see dumb money in retreat. If a real correction ensues it will retreat much deeper before a real (non-daytrading) ‘buy’ is possible.
Market Indicators: An ongoing mix of indications stating two things: 1) a sedate backdrop with seemingly not a care in the world and by extension, 2) high risk to broad stock markets, but especially in the US. <<<[unchanged] but NEW> the spike in the VIX will either indicate ‘back to sleepy calm’ by failing or ‘it’s getting bearish for a phase’ if it continues.
Global Markets: No segment below this week, but note that global markets have cracked to varying degrees depending on their anti-USD character. For example, EM got clubbed on Friday while Europe actually ticked up a bit.
Precious Metals: Last 2 weeks: “Silver… ah silver. It don’t come easy. But it do come (I think).” It did come. Curiously, however, silver continues to lag gold. If the macro is really getting an inflationary bounce we’d expect that to change. If the inflation bounce fails, Silver/Gold may well have been a negative divergence. Gold is in a real bull market. Silver is not yet. The miners target GDX 40 (+/-) and HUI 300 (+/-) and the downtrend channel top. The macro is shifting favorable (counter-cyclical), but well, it don’t come easy (or quickly).
NEW: It came even intensely, potentially to ‘show stopper’ (for a while) levels. We will have to see if what our eyeballs witnessed (big up and then hard reversals in gold, silver, miners) translates to what usually happens. If so, a correction can ensue at any time and it would come from below our targets of HUI 300 (+/-) and GDX 40 (+/-), which can still happen later. That correction would likely see silver pulling back harder than gold. If so, commodities and many other areas could be impaired. See segment for much more detail.
Commodities: See directly above. We had the anticipated renewal of inflation anxieties in the markets and it became deafening at last week’s CPI release. With silver’s show of force and many commodity-related areas overbought, it is time to at least consider the contrarian alternative. Nobody is thinking deflation or about liquidity problems right now. Well, nobody maybe but Uncle Buck and the Gold/Silver ratio.
Currencies: USD breaks out above the key 105 resistance area. If it keeps going and brings along its fellow, the Gold/Silver ratio, it will be advisable to appreciate gains you’ve made in this market because the theoretical market correction likely would not pick favorites. The clear favorite would be cash (until the next buying opportunities).
The End of the Beginning?
Or the beginning of the end?
The breakout to blue sky in gold meant something and that something was not that sabres are rattling in the Middle East, crude oil would soon spike to $200/barrel as world war III engages and a global grab for precious commodities and resources will soon ensue. It simply meant that the anti-bubble, gold, is getting into position for the next major macro shift. In our ongoing work, that shift would become clear after 2024’s market bull either makes it to or through the US presidential election or fails before hand. More on this later.
If I am wrong and the WWIII crowd proves right I will eat may hat with a side of crow and admit that Team Tin Foil has finally got it right. But more likely, gold broke to new highs based on a coming end (or extreme interruption) of the bubble in the cyclical world, regardless of war drums that may be beating.
It is also not primarily about China and India buying (cue the “Chindia love trade” promo), central bank buying (for every buyer, someone is selling) or anything other than monetary preparedness for a post-bubble environment. Whether that environment will be deflationary, inflationary or in my opinion, both.
One scenario: the government will try to fiscally inflate (stimulate) at every negative turn to an economic bust and the Fed may try some of its previously effective monetary inflation tools, but these operations will not work to the positive short-term effect they have in the past. Even when successful, the benefits were illusory by definition of the boom/bust cycles that went bad in 2001, 2008 and whenever the bust of the 2020 inflationary operation comes. Before the Continuum broke to the upside, liquidity problems were handily mopped up and sanitized mainly by Fed monetary (inflation) policy with ongoing government fiscal stimulation.
In the new macro, I’d project government trying to do the heavy lifting as it is politically driven while the Fed, comprised of economic eggheads and more macro driven, will be rendered less effective (or willing). One conclusion we can draw is that yields would continue to rise over the long-term and the public would take the brunt of the pain since the government can do whatever it wants, short of revolution. This could be a recipe for Stagflation in the years ahead.
With bond yields having rebelled, in essence giving the finger to the old way of doing things, new inflationary phases will be much more economically corrosive because if the breakout is real (it is) and the moving averages get tested successfully the bailouts will not come with the Continuum in the 2.5% to 1% range as they had from 2008 to 2020. They will come from above the now green, upturning and formerly limiting moving averages in the 3.1% to 3.4% range. That range represented the last high of the old macro in 2018 and is projected as the low range in the new macro. “New macro, new rules” indeed.

Bottom Line
Gold has long since made its move to blue sky. Some geopolitical hype drove it to target on Friday (2431 vs. actual target of 2450) before a not surprising reversal came about. That may have been the end of the beginning of gold’s new big picture macro move with its next target of 3000, possibly after some violent volatility and a correction and possibly after the wider markets finally crack and the bubble deflates.
Gold
It was a little difficult doing Friday’s cautionary update because I do not control the markets and maybe it’s different this time. But I can only go by my experience and that compelled me to state what I thought was coming, and by Friday afternoon, it came. A hard reversal by the mythical Mr. Slammy, who is actually an amalgam of ‘sell the news’ traders, contrarians and yeah, probably a few nefarious interests in the market as well.
If the downward reversal is a precursor to a correction the green shaded support shelf looks like a very doable target as the 50 day average rises toward it. If things get really bad, we’re talking about the 2050 to 2100 area toward which the 200 day average will be rising. But gold has broken out. Gold is bullish and any such decline would be a clear buying opportunity.
As an aside, don’t be surprised if the reversal candle does not play out bearish tomorrow. It was not just us who saw the reversal and its implications. There could be some grind up here, including the potential to tick the 2450 target before a correction becomes obvious. But at this overbought level, risk has obviously increased.

Meanwhile, I am not authoritative on the meaning of a chart like this (thank you, Betty), but logic would have it that casual gold bulls – those who would buy GLD to have “gold” – have been fading. Contrarian-wise, that may not be a bad thing because such holders are not died in the wool gold bugs. Somebody has been buying the actual stuff even as the casual ‘momo’ bull has gone on to AI and back into Bitcoin.
I think this is a reflection of ‘risk on’ and ‘bubble on’ among a majority of investors, and so I don’t assign much negativity to this picture because we have been noting all along that the gold sector’s fundamentals are not complete precisely because it was still ‘risk on’ and ‘bubble on’ in the macro. Real buyers of real gold (including global citizens and central banks) probably don’t much care what GLD’s holdings are doing.

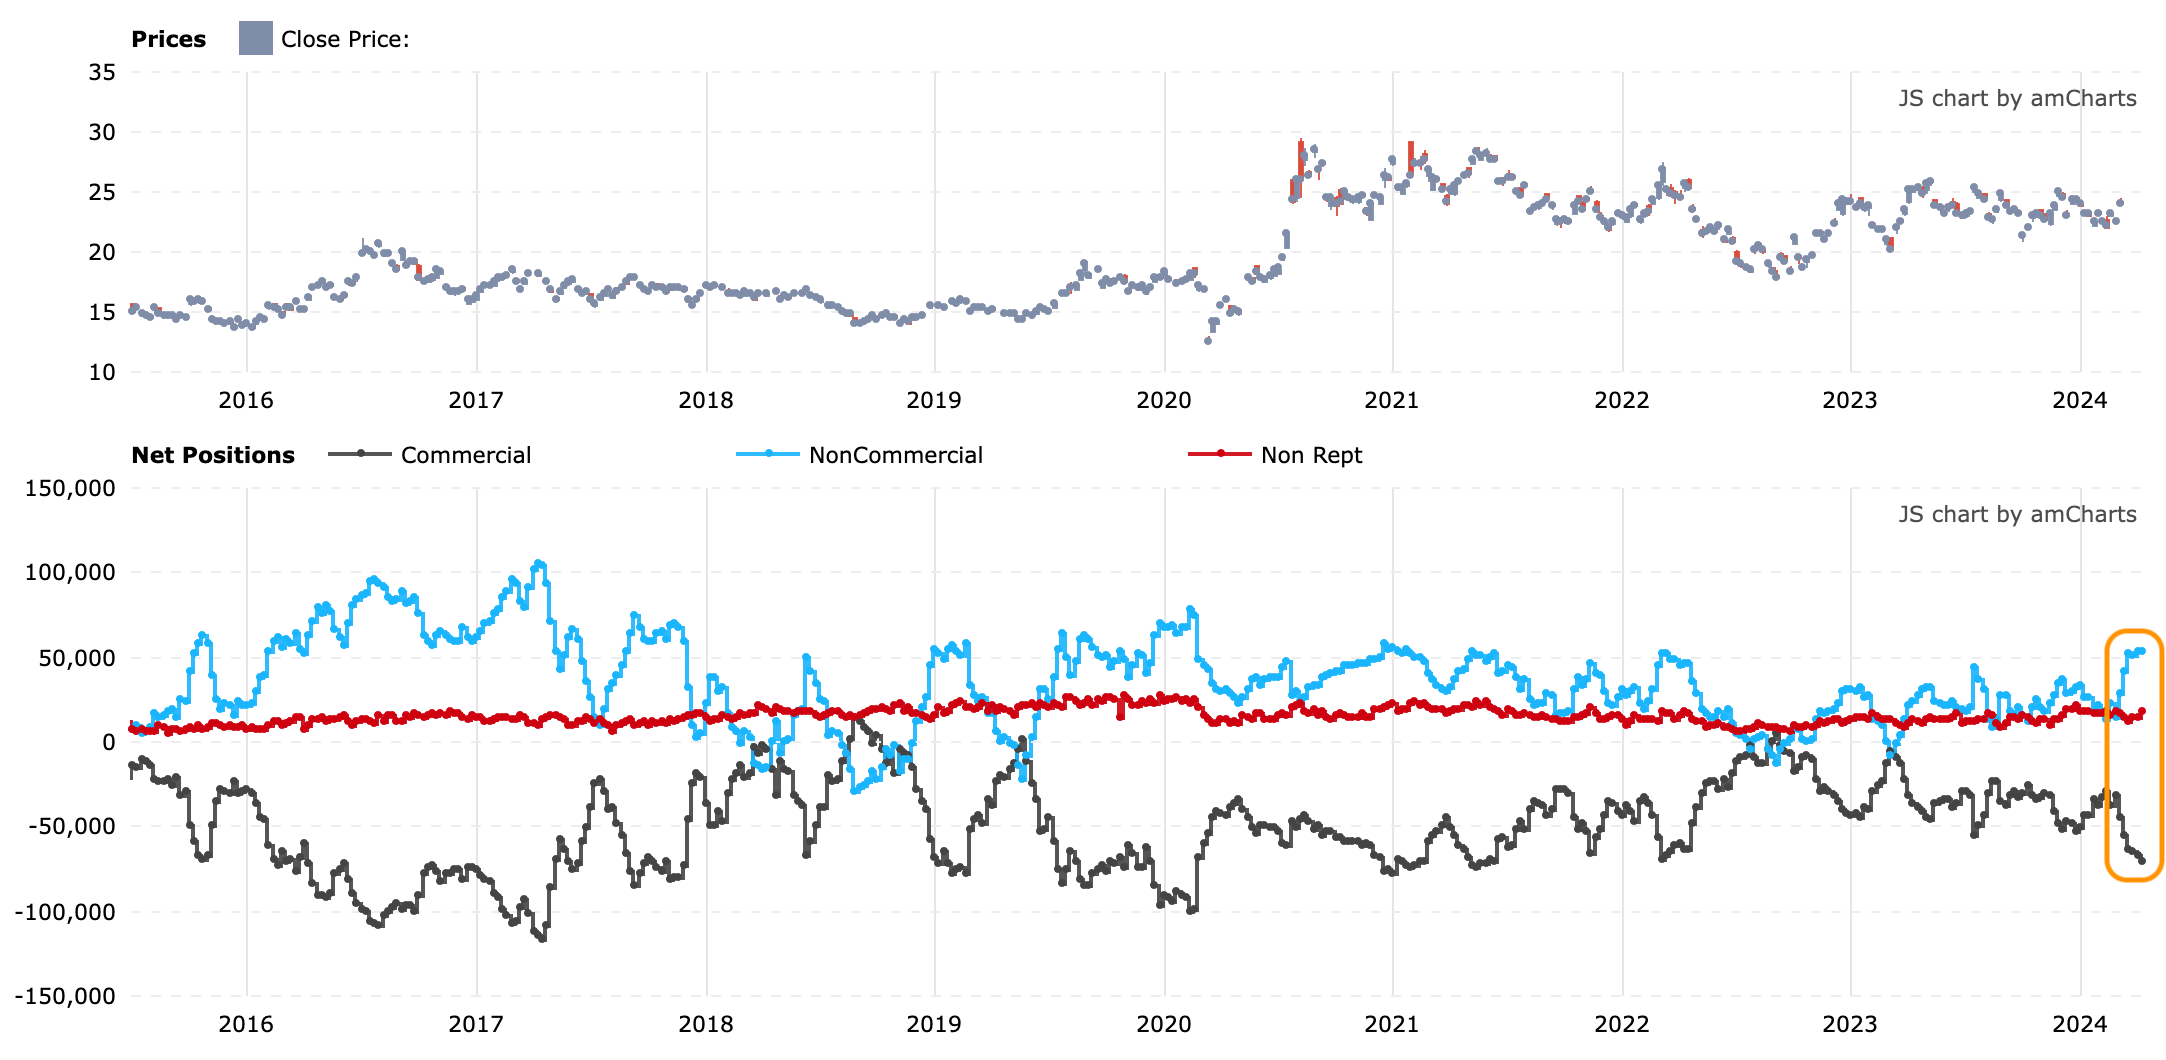
But there is an element of caution to the above as well. Also, the gold and silver Commitments of Traders were elevated before Thursday and Friday’s up moves. It’s a sure bet they became more extreme during those two days.
Gold’s CoT has been contrary negative, which is the condition that a rally will always drive it toward, as logically Speculators speculate (and drive rallies) and Commercials hedge (taking the other side of the trade).
Don’t over complicate it by listening to those talking about the Commercials as “smart money” and specs as “dumb money”. Those are cartoons. This is simply the structure of the CoT and how it operates. Specs are smart all the way up while I assume booking profits, while hedgers are dumb all the way up, finally becoming right at a termination point. Lazy analysis wants you to believe that these are forces battling each other when actually they are two primary components of one market indicator doing what they always do.
Gold’s CoT is extended and could precede a correction, but it is not at all terminal in the big picture, which aligns with the technical view noted above that a correction would be the first buying opportunity of the beginning, not an end to the larger bull case.

Silver’s CoT had popped to a bit of an extreme even before Friday’s fireworks. As with gold, the situation did not reach ‘bull killer’ levels, but it did reach levels that could dovetail with our analysis above on the potential for a pullback in gold (and silver).
Transitioning to gold miner signals, BPGDM as noted last week in NFTRH 804:
The Gold Miners Bullish Percent shows a situation that is getting overbought. However, if the bear trend is ending it can get more overbought. Note how the most recent low in the 20 month EMA was a higher one to the previous. May be nothing. May be a new paradigm. Either way, if BPGDM were to rise to 90 or higher, an extreme overbought caution reading would be in place.
The situation closed last week even more extreme and overbought. But again, not a ‘bull killer’ like the two instances noted as “caution”. This too aligns with the views noted above about a likelihood of correction within a new bull phase.

However, lets compact and simplify the monthly view above to a daily view for a strong signal that the play is overbought. The sector is bullish, but at high risk. The tough thing about the gold miners is that they will tend to sit on the their butts interminably and then when they get going, the GO… and they do it quickly.
I believe that the BPGDM is turning upward into a new bull trend as the monthly EMA 20 above looks like it is bottoming. However, in alignment with the work done on gold and silver above, a correction is likely within that new bullish phase. In other words, if the sector corrects, it’s more likely a buying opportunity than a return of the bear.

HUI propelled up to 280 before recoiling and turning negative on Friday. That shot upward was still below the 300 area channel top target (equating to the GDX gap fill just below 40). But in the event that the situation topped on Friday, as is possible if not probable, I have added Fib retrace levels from Friday’s high. The 38% level coincides with support at 250. The 50% level is 4 points above support at 234. The 62% level coincides with strong support and the converged moving averages at 227-229. What’s HUI got going for it? Well, RSI still looks orderly in its uptrend. So, open minds (speaking to myself, given the DUST hedge I hold).

The weekly chart shows the resistance area that halted the rally below the channel’s upper line. Again, this could just be a fuel stop before another up move, but typically in this sector when we see upside events reversed harshly as we did on Friday the signal is negative (or positive if you’re a greedy buyer). For GDX to fill its sub-40 gap HUI would probably need to spike up through the channel. Those targets are still technically in play. But pending coming action I am not putting my money where my targets are.

The gains have been very good, but the sector was running with oil/energy, industrial metals (led by copper), uranium and of course on a wider scope, the broad stock market (fanned out to commodity/resources/materials areas as anticipated). The gold miners will be unique in their best, post-bubble suit. Not there yet. Hence, no heroics for me (e.g. buying hand over fist in Q4, 2008 as the sector utterly crashed with fundamentals screaming higher) at this time. Just booking some profits as I would any other sector.
While we can call gold’s measured target of 2450 “in”, like the miners above, silver’s measured target of 35 is not. The spike to 30 got reversed and like the miners, it remains to be seen whether there is another shot upward short-term or the targets will wait until after a correction. Personally, having raised cash I will not rush the answer. Maybe it was an all too obvious “Mr. Slammy” moment for gold and silver on Friday. But patient and grounded I shall try to be.

Broader Markets
If I am cautious on the precious metals I am also now cautious on the fanned out stuff we had projected to join the rally. That would be the Materials and Energy sectors along with global markets rooted in commodities and resources. Here is one potential I have in mind:
With inflation hysterics getting pumped again last week (on the back of services and energy CPI components) and Treasury yields ramming higher in the face of a Fed that very much wants to start easing the Funds rate, what is left to tamp down the situation? An all out broad market correction. That would tamp the consumers of all those services (we note month after month the booming services sectors, including government in the payrolls data) down, and it would reverse oil prices as well. I know, OPEC this, inflation that. A forceful liquidity event would not care.
A broad market correction is needed and it would put a scare into market participants, put downward pressure on some of the components of rising price indexes and likely, cool down and at least temporarily reverse the rise in Treasury yields. Eh? A little negative liquidity situation as we head toward summer?
That prospect is another reason I am now cautious on the precious metals, because gold often leads silver and the miners (in this case it did) to the upside and the PM complex often leads other markets to the downside. So again, was Friday’s reversal meaningful? If the precious metals take a correction, pressure could soon increase upon the broads as well.
We anticipated a round of inflation trades and internal market rotations and that is what came about. If Friday’s reversals mean anything, we might have just seen a signal of an oncoming broad correction. Best of all, this would dovetail with our view that for the powers that be to drag the bullish process to or through the coming presidential election, a healthy and hard correction is probably needed.
Per one of Friday’s video updates we took a quick look at SPX and noted the cluster (4700-4800, now shaded green) as a healthy pullback objective. With the daily SMA 200 rising toward it this level is all the more important. That’s really all that would be needed to clear the pipes of an intact bull market for a run into Q4. Eh? After that there is clear support at 4570.
SPX does not break down technically into a clear bear market unless it violates the January low of 4682. But a drop to the SMA 200 is all that is needed and frankly, anticipated if a correction gets going. SPX is sitting heavy on the SMA 50. Now let’s see if the pig gets any heavier.

NDX shows us some of the gaps that could fill while still remaining in a bull market, and viable to bull into Q4.

If a correction were to start (and with the indexes above resting on the 50 day averages, it is not yet indicated) it would finally prove out the negative message the VIX divergence has been sending to us for weeks now.

Yet High Yield spreads are still asleep. They could wake up at any moment and follow a correction, but as yet they certainly are not forecasting one with any kind of divergence. The signal is that market players are still risk ‘on’. Because why should this market give us too many corresponding signals concurrently? This sleepy behavior will have to change in order to put a hard correction into the macro and begin to impair liquidity. While not shown this week, T-Bill/Libor yield spreads are also on a message of calm.

With the idea that a correction is possible, a potential not yet realized by a bare minimum of market participants, let’s move on to a couple other items.
Just so we are clear, GDP growth has since 2020…

…come with an intense up-surge in debt, to the tune of $34 Trillion.
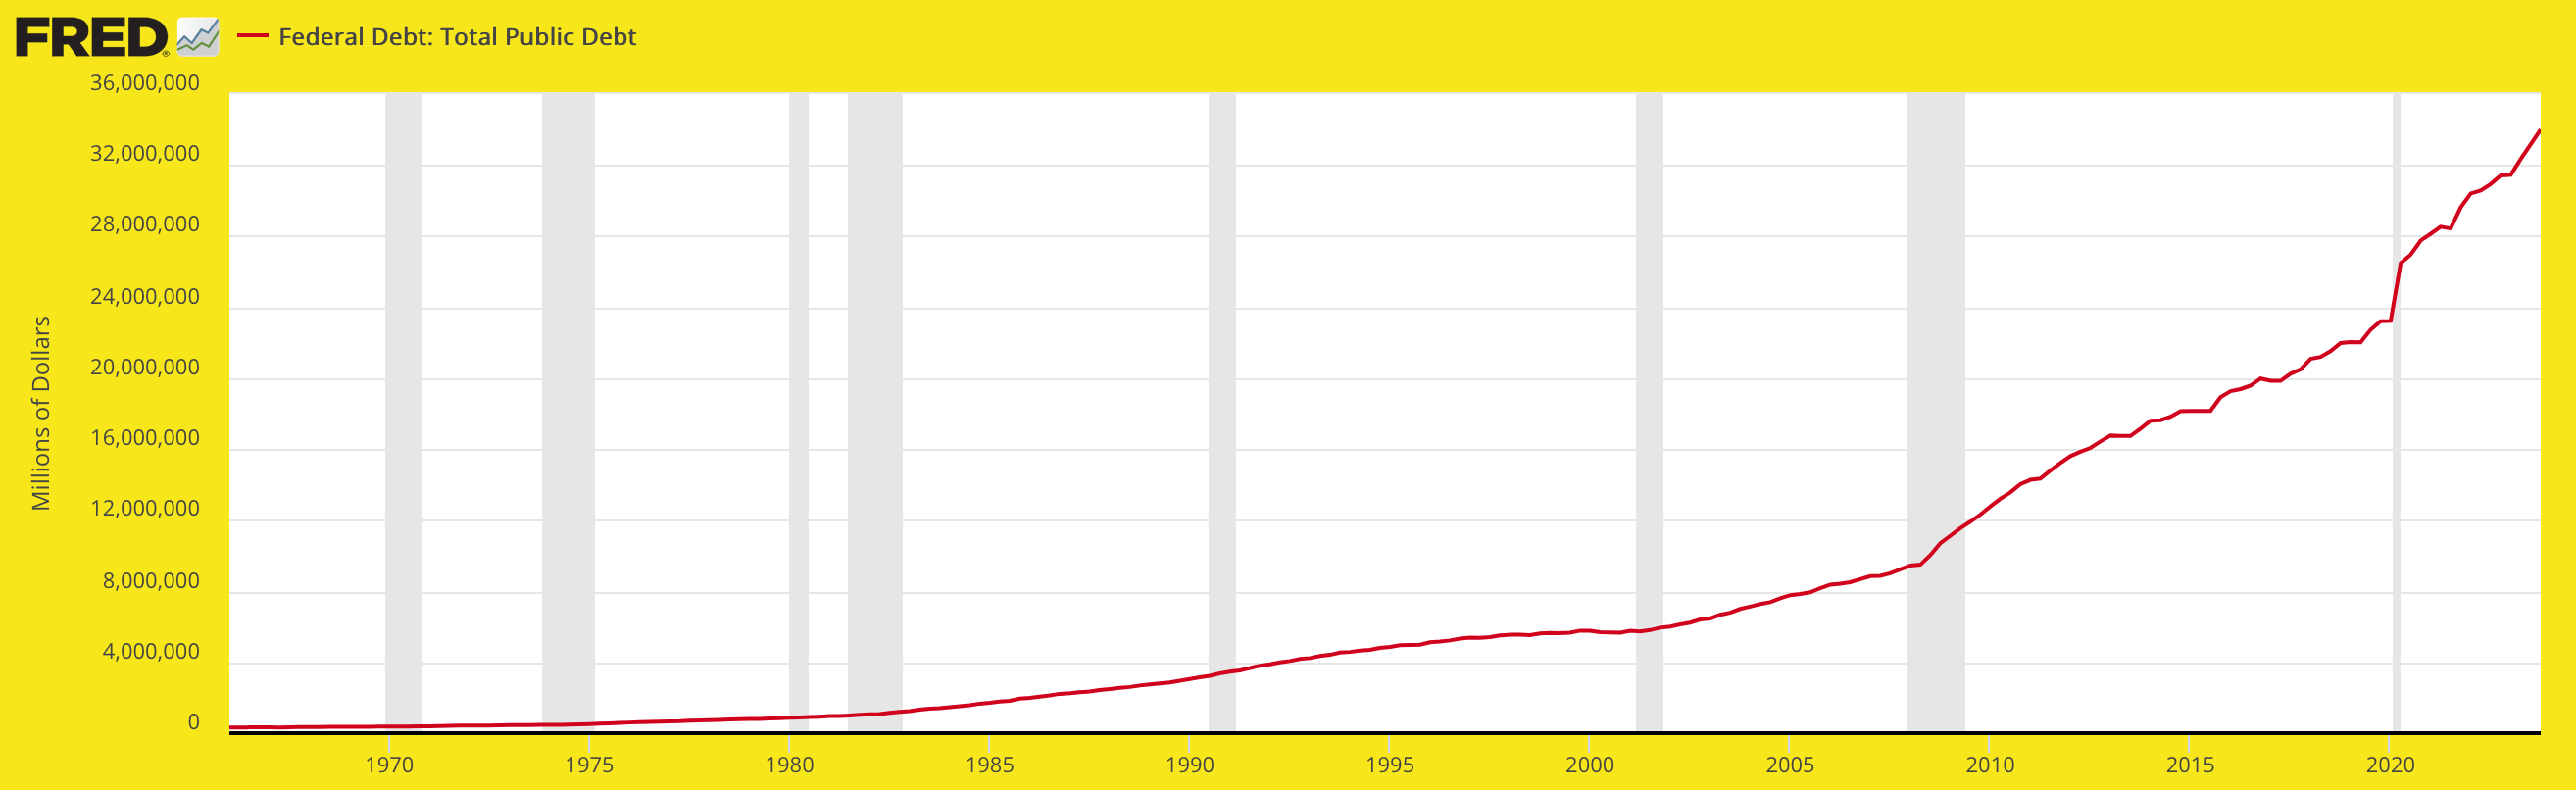
It is a debt Ponzi scheme. There is no other way to put it.
In my opinion it is a terrible bubble with no preordained end date. That will come when a critical mass of humans realize they need to wake up and stop letting mainstream financial media, Fed mouthpieces, politicians and the general forces of a late stage, hubris-addled society tell them what to think, and start thinking for themselves.
With the stock market a manifestation of this great debt-fueled edifice, they simply cannot let the situation deflate, or die trying not to let it deflate. But how on earth can it be called productive or even real if these two lines continue to climb together? The real case for gold? Anyone? Bueller?
US Dollar & Gold/Silver Ratio
The recent inflation trades finally got a bit of a tailwind as the Silver/Gold ratio (SGR) rampaged upward. From an NFTRH+ video update on April 10:
“This [a breakout from a trend channel] is basically a middle finger to the Fed right here, thus far. It could be the last gasp of the precious metals to flip the bird before this turns out to be an overthrow and a fake out and a return down to the bottom of the channel. But as long as it’s up here and in breakout mode we continue with it and we note that the inflation trades are not done, the precious metals are not done and a harsh correction in asset markets is not indicated. However, this thing could simply be channel breaking and looking to make a lower high to the December high… “
Here is the chart as it closed the week after busting the channel, stopping short of the December high, and reversing back down into the intermediate up channel. The SGR is still technically constructive, but historically in my experience silver sends to make grand statements at the END of moves. Within the context of a minor rally, the spike and reversal was fairly grand. Not anything like the big blowout in 2011, but capable of failure back into the existing downtrend, ending this leg of the precious metals rally, commodity rallies and potentially, adding more pressure to broad markets.

Let’s flip it over to the Gold/Silver ratio (GSR), which had been negatively diverging the US dollar. Might the dollar have been leading the ratio? If the GSR holds here and turns up hard USD could make a new high above the October high and if that were to happen…

…the 2 horsemen of the Apocalypse, that is to say liquidity destruction, could ride again. For newer subscribers, the point being that gold is less cyclical, less inflation sensitive, more monetary and more stable as a safe haven than silver. Hence, it rises in relation to its little bro during times of liquidity stress and other counter-cyclical crises. If the two ride impulsively upward together, the liquidity destroyer and the anti-market should oversee a widespread market correction.

Of course, Goldilocks Tech had benefited from gentle disinflationary signaling in 2023. But if these two were to go up impulsively there would be nothing gentle about it. I would not expect Tech to act as a haven. Even the gold price would be likely to get corrected. But the key point is that it would trend upward in terms of other markets.
But that is getting ahead of things, noting something that could happen, but is not yet indicated to be happening. Other options are that silver could pick back up and the inflation trades continue (not favored), or US stocks (esp. Tech) could gain a strong dollar bid while gold and some global markets get woodshedded (not favored, but it’s a movie we have seen before).
But at this time let’s realize that it is possible that Friday’s pop and drop by silver and the SGR may have been the exclamation point on the rally we had anticipated to fan out to include commodities, cyclicals and inflation trades. We planned that rally ahead of time and I am simply laying the groundwork now to plan for its end.
The End
This report had a lot of points to make, hence routine coverage of global markets and commodities is omitted in favor of what I consider to be more important information and analysis. I have raised cash, taken defensive measures and now wait to see what shakes out. Gains were booked, and that is always a good thing.
Portfolio
Funds are balanced by gold (long-term risk management & monetary stability).
Holding Au/Cu explorer AE.V in a separate account. It’s a long-term play if its story remains intact.
Roth IRA (non-taxable, no contributions)
Cash was cranked up to 90% as the IRA is now highly risk managed. While positive thus far, DUST will be watched closely because I have small enough gold stock positioning now to be able to ride out coming volatility without it. But we shall see.
I am not ready to short the stock market unless the 50 day averages start to fail. Even then, shorting would be for speculation, not hedging, because positions have been greatly reduced and would be reduced further. My view is and has been that CASH is the best risk manager, and it’s paying income!
The report above laid out the grounds for a market correction. If I am wrong, I will adjust. Simple.

Cash & income-paying Equivalents are at levels that are right for me and my real-world situation. Your situation is different. Cash will be adjusted as needed.
Refer to the Trade Log under the NFTRH Premium menu at nftrh.com for trade info, if interested (not that you necessarily should be). Also, you can follow at Twitter @NFTRHgt for notice of updates.
NFTRH is not to be distributed to third parties without prior written consent
Notes From the Rabbit Hole (NFTRH) is a weekly market report in which we provide analysis on financial markets. We make every effort to provide accurate and high quality content, but this analysis ultimately represents our opinions and these opinions are provided without warranty or guarantee of any kind. See full terms & conditions of service under the ‘About’ heading in the main menu.
