
Summary
US Stock Market: Indexes break trend channels and take out October highs. Technically bullish and the seasonal is positive.
US Market Sentiment: Neutral now as previously over-bearish participants start to chase the rally. If the bullish seasonal plays out sentiment could become briskly, even extremely over-bullish, which could be a marker to end the bull. For now, sentiment is not standing in the way of the seasonal.
Indicators: Market breadth per SPX headline and SPX equal weight is bad. Sentimentrader notes bullish ‘Zweig’ breadth thrusts in play, however, which rhyme with our seasonal option. Gold/Silver ratio perches positive (negative), while USD is suspect (would-be positive). The tough talking Fed repelled the steepening yield curve last week and that blew a Goldilocks breeze across the markets. High Yield spreads are subdued and positive. Real Yields are still in pullback mode, which implies slightly easing monetary conditions, and is positive. VIX is downtrodden implying complacency, a contrary negative. Employment is easing, unemployment may have bottomed and turned up and manufacturing is decelerating hard. Negative, but it may not matter during a seasonal party if the machines so decide.
Fiscal Inflation View (as per recent weeks): In my view, this comes later. Perhaps at the trigger of a deflation scare.
Global Stock Markets: Mixed bag, market by market. As a whole, the US dollar, which is short-term technically suspect, will play ‘anti’ market. In other words, if USD corrects the world can party for a while. See segment charts for individual market status.
Precious Metals: Gold, silver and the miners sit right on or just above important levels to hold in order to keep a short-term rally potential in play. Generally, the sector is showing some unique characteristics in not partying with the risk ‘on’ stuff. That would come in handy in 2024 if/when the positive stuff fails. If support fails, prepare for forward buying opportunities. Also see segment for gold miner upside levels that would set the sector free from the correction. For now, patience and perspective. We’re trying to change the macro and that does not happen in a day, week or month.
Commodities: Commodities are still no good. The theme for 2023 was projected as disinflationary Goldilocks and that is exactly what has come about and it is why commodity weakness is more than logical (unless you’re biased or influenced by influencers). That said, let’s not discount a potentially profitable tax loss play in many commodity related equities in long downtrends. See segment.
Currencies: USD is short-term technically suspect as it flags upward test its breakdown from the March high and the daily SMA 50. If it’s sometimes partner the Gold/Silver ratio furthers its currently constructive stance and USD bulls then take caution. An alternate scenario is the 2001-2003 situation when the GSR rose, USD declined, the broad macro declined but the gold stock sector bulled.
US Stock Market
From Tuesday’s Trade Log:

With the weekly close in QQQ, SMH and SPY in trend channel breakout mode and above the October high we can only say that the seasonal rally is continuing, technically. I will not fight that. But I may rejoin that (more so than I already have) for a seasonal trade. There is, in my opinion, little value here as players chase the biggest names, with the likes of MSFT, NVDA (once again) and AAPL (once again) darting upward, pulling QQQ along with them.

The weekly chart situation does hold a modicum of caution in that there is a resistance area right at the 2023 high. Regardless, we are still operating to a ‘double top’ plan in the US indexes. That secondary top may have happened in July or it may happen at or above the all time high. If it’s the latter option, it would be a grand bull trap suck in. That is an unchanged view.

I continue to find this view of horribly bad breadth to be very important. SPX is starting to gun the pedal while Equal Weight SPX continues to slip slide away into oblivion relational to SPX. The market has thinned out and some autopilots out there appear to be driving the bus as they would during a seasonally positive holiday period. The fact of this chart is that less profound breadth divergences preceded the crash of 2020 and moderate bear phase of 2022.
If this signal works as advertised, the dramatic extent of the current divergence fits our view that a real bear market will ensue in 2024, unlike the quaint little thing that happened in 2022.

Back to the daily ‘management’ chart of SPX, we note that the 4401.38 gap, which had missed being filled by a teeny on the ‘4’ leg up, was filled on Friday. Like QQQ/NDX, SPX is lurking below a resistance area (4450) and last week was a continuation of the impulsive spike the week before, likely with the mission of filling that gap. If its aim was to fill that gap before declining anew, it will have been a bull trap on a technicality (gap fill). However, the state above both generally uptrending moving averages is the driver and it is still bullish. These are the potentials I see (bullish and bearish), not the predictions I’ll make.
By taking out point ‘4’, the implication is a rally to new highs. But there is enough evidence to the contrary to remain far from committed to that view at this time.

In contrast to the message of the equal weight S&P 500 vs. the headline S&P 500 and its terrible trend in breadth indications, Sentimentrader, which does much more work on these conditions than I do, is all bulled up on Zweig Breadth Thrusts, which are triggering on the NYSE, Small Caps, and others triggering rising price/low volatility expectations among adherents. I do not tend to get bogged down in this stuff because sometimes you can get data bombed to death when simpler views will suffice. But I like to keep tabs on them periodically.
The general bottom line is what it has been; there are many positive and negative signals in the market right now and it’s going to shake out with the story being told in hindsight. But bullish reactions to these breadth thrusts would still rhyme with an extended rally in the near-term and the view of a top in H1, 2024.
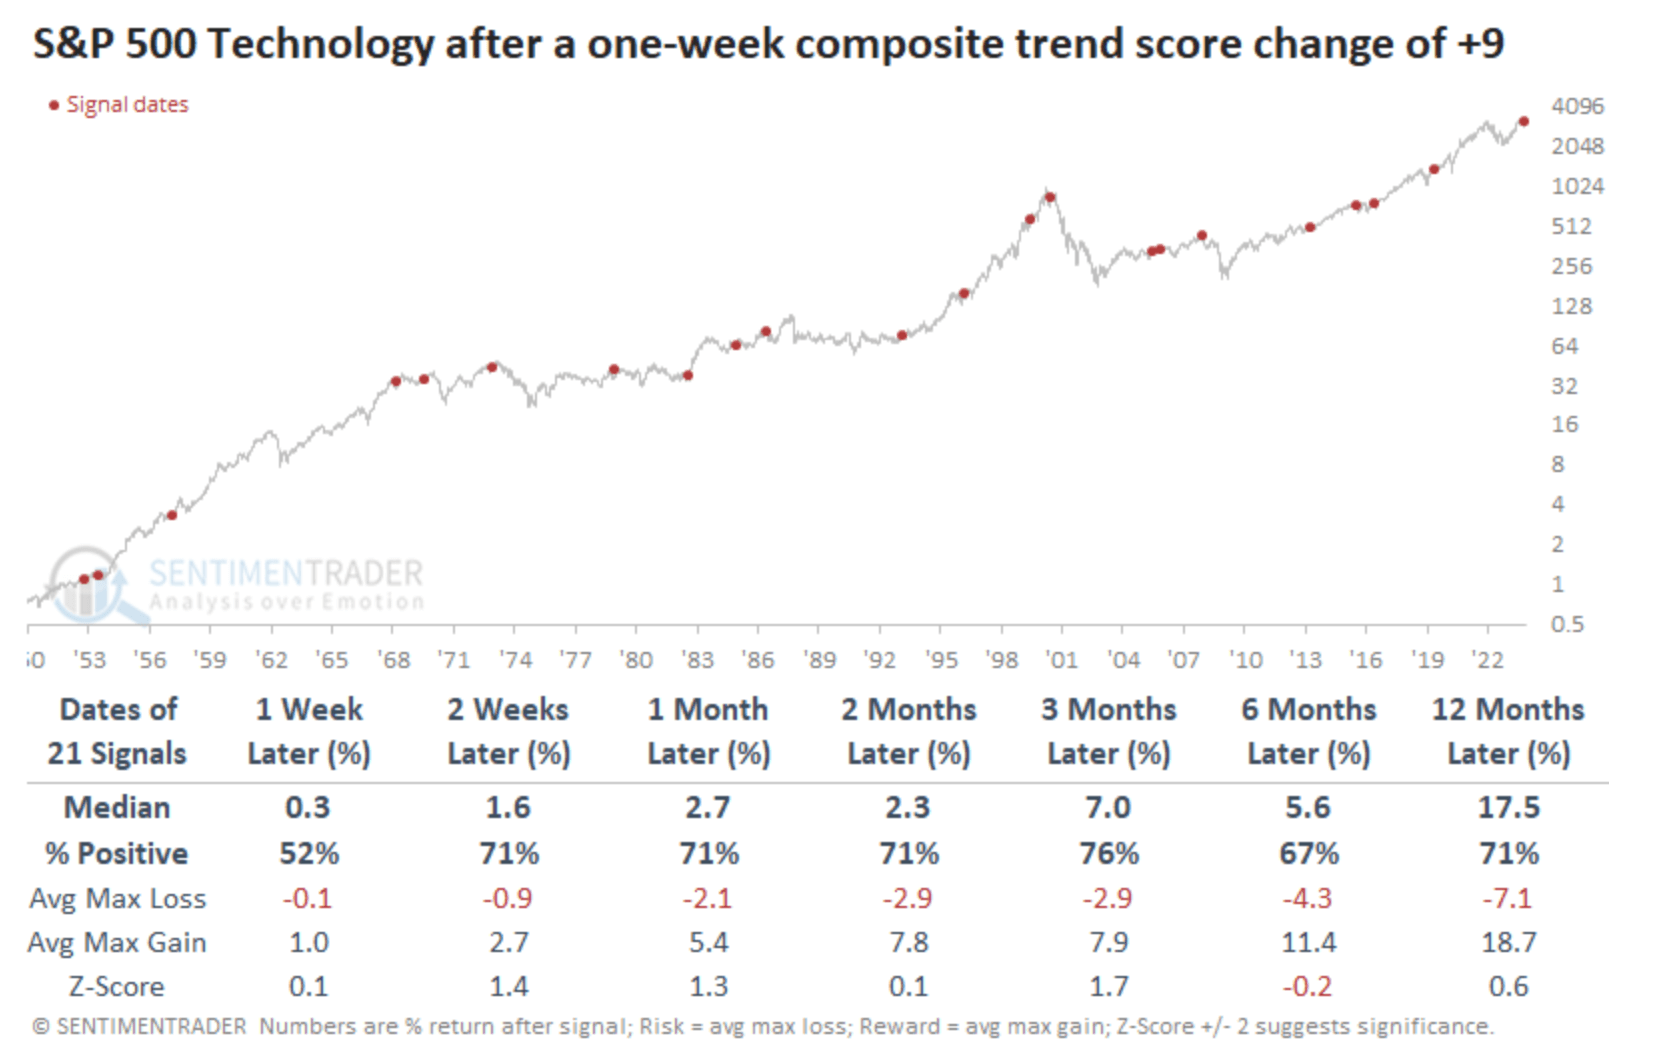
Tech has had a big surge in trend score. Without getting too detailed, we’ll note that a net change in early 2023 coincided with a big bull move up in Tech. That folks, was our anticipated 2023 Goldilocks bull, as led by Tech. This data imply (not guarantee) another leg up after the solid downward consolidation from July.

Here is the data set to back it up. As you can see, the odds favor the bulls. Now, will the stock market ‘quant’ history reliably in a time when other indicators imply major changes at hand? It’s no sure thing. But the historical data are what they are. But a couple points to consider:
- Most occurrences have come during bull markets, by definition. Looking at the graph, 2000 is an example of an occurrence that came at the end of a bull market. 2007 as well. Just sayin’…
- The concept of a macro that has changed fundamentally argues for caution against robo-think, against automatically making quant-like assumptions based on history.
Healthcare, a more defensive sector as a whole, is having trouble kick starting its seasonal, but it could resume if its average seasonality holds sway.

The ratio of Healthcare to the broad market is still in Drubsville. It is a picture of high risk to ‘risk on’ trades, but also a still relative bullish underpinning to those areas. Considering the seasonal, risk/reward appears to favor some defensive positioning. Beyond that, this is a picture of bear market triggers. Extreme lows (yellow) reflect high risk of oncoming bear markets. The question is, when does it bottom? No sign of that yet.

A subscriber reminded me of my old Dow Theory shtick, using ascot wearing, cognac sipping Clark as its emblem. I completely forgot about ole’ Clark who, in his ascot and fine suit, cognac in hand, practices an old fashioned market discipline called Dow Theory from his well appointed cherry wood office while the little woman dutifully prepares the Beef Wellington in the kitchen, leaving our Dow Theorist to his important work of noting positive and negative divergences by the Dow Transports. There is celebratory Clark and there is forlorn Clark. This week, we have forlorn Clark who is pensive at best, as the Transports lag the Dow.

Ending with the view of the SPX seasonal pattern we’ve discussed previously, the technical odds are for a rally, and the seasonal agrees. With all due caveats as noted above. Let’s watch to see what SPX does after the gap fill.

US Market Sentiment
Short-term sentiment risk has jumped for the stock market (hmm, just as it fills an upside gap and approaches resistance as noted above). Meanwhile, risk ‘off’ bonds and gold are in the best contrary sentiment shape on the short-term. As for smart and dumb indicators, Dumb Money’s fade does not square with the short-term risk shown below, although Smart Money’s fade does.

NAAIM (Investment Managers): Jumped from only 29% bullish to 62% bullish last week. That is a significant lurch toward market chasing. There is higher to go if they are going to approach 2023’s peak bullishness of 101% last summer. But in the short-term, this lurch is a caution.
Investors Intelligence (Newsletters): Last 3 bull/bear ratios were 2.06 > 1.67 > 2.06, so II are just mushing around biding time, sort of like your letter writer. It’s a middle ground reading with a neutral signal.
AAII (Ma & Pa): Put on an enthusiastic spike to a 1.6 bull/bear ratio, which is below the extreme last summer (2.4) but well above the depressive downside of .5 just a week earlier.
Sentiment Bottom Line
Neutral at this time.
Global Stock Markets (daily charts)
Please take due note that local currencies play a role in market performance for global citizens. NFTRH being American, cannot get too far afield managing all those moving parts with my simple charts. So global market comments and charts are for reference.
World (ex-US) and Europe are nearly identical in downtrends from July, but bouncing to perhaps try to undo the downtrends, which will require talking out the moving averages.
UK and commodity/resources heavy markets Canada (TSX) and Australia are all in moderate downtrends from the summer.

Japan’s Nikkei is back to its bullish stance after testing the SMA 200 but not the major support area I’d been looking for in order to position.
Hong Kong is robo-trending down as are China large caps (not shown). Asia (ex-Japan, not shown) and EM ETF are very similar, trying to break downtrends if only the US dollar will cooperate by declining.
Canada’s TSX-V is probably under immense tax loss selling as committed junior resource stock investors prepare not only for a lump of coal for Christmas, but more cow dung than actual resources up there in the pastures of the great white north. This could be a potent post-tax loss seasonal play, however.

Brazil has furthered its constructive look noted last week and Argy is holding the SMA 50 nicely.
Mexico, Africa ETF and FM are all trending down, with the latter making a concerted effort to bounce and perhaps break trend. FM is driven largely by Vietnam, which is bouncing hard.

Currencies
Global markets above, along with many US sectors, commodities and precious metals will be affected in varying ways by the status of the world’s reserve currency. The fundamental status is the Fed chief in the media still reverberating hawkish about inflation fighting. That’s really it, because USD is not supported by sound backing otherwise as the government appears to debt-spend as needed and at will.
Powell is still talking hawkish I think because he wants to crack the markets (US stocks have been a primary beneficiary of the 2020 inflation operations) he’s doing what he can to support the dollar in that regard. Technically, USD is flagging upward to test the breakdown below the daily SMA 50. RSI is snapping back to trend (which is down) and though it’s tentative, the bear case still has the ball on the short-term. But boy, this market never seems to make it easy. Indeed, “it [usually] don’t come easy.”

Meanwhile, gold is still trending up vs. Uncle Buck’s global competitors even as it is on a hard pullback relative to them.

The macro signaling is that in the short-term we have a speculative atmosphere, which would be right in line with a continuing seasonal relief party for the global macro. What better way to illustrate this than the bearish state of a sound monetary anchor vs. the most speculative currency unit on the planet? We first noted this a few weeks ago and it has since gotten worse for sound money advocates (better for speculative players).

Precious Metals
Gold lost initial support as anticipated and is now testing the daily SMA 50 and SMA 200, as also anticipated. But much as we noted parameters for GDX in this video update, gold’s parameter to keeping things normal is a general hold here at those moving averages.

Silver is sitting heavy on the key support level after not having done anything bullish previously (held below the moving averages). As it stands now, it is not a bullish picture.

Here is the chart of GDX from the video update. The second recent gap is filled. As noted in the update now it is time to hold 26.60 and get the heck with the seasonal program or else the sector goes bad for a while.

Now importantly, that would not be the worst thing in the world. If gold stocks weaken while the cyclical macro parties it would be a detachment from the norm of most markets. What are we looking ahead to in 2024? A time when gold mining becomes a unique, counter-cyclical industry. Detached from the others. So who’s to say that detachment does not start off with a disappointing seasonal performance while risk ‘on’ parties to a perhaps last hurrah?
However, the sector can play seasonally as well. It has not proven out the short-term bull or bear case yet. Hence, I am not even in the same galaxy as loaded up on the sector. I’ve waited with the larger correction since mid-2020. I’ll wait a few more months if I have to.
That said, the macro ratio charts are still uninspiringly grinding toward constructive. Thursday’s article showed the daily view. The weekly view continues to wait for gold to make a real move vs. stocks, to further its fledgling move vs. commodities (incl. miner cost input, oil) and for the Gold/Copper ratio, a primary counter-cyclical indicator, to continue upward in its trend from 2021.

Weekly HUI… well, it don’t come easy.

While there is the potential for the seasonal party to abort and gold/gold stock fundamentals to improve in the short-term, it’ll be best to keep the patience we’ve had since the 2020 top and more recently since the May 2023 top. It’ll be best to think like a stalker, a future capitalist rather than a victim. Mindset is everything.
My article’s title stated that the time is now… but liberty taken with wording, which I probably should have moderated. “Now” is macro relative and generally for an oncoming phase change. I think the article’s details made that clear.
Meanwhile, the sector is not broken from its potential to rally but it needs to do so promptly. I will not feed it additional positioning until/unless it holds here and moves upward.
Notes
- Gold and silver Commitments of Traders continue not to be extreme in either direction and appear neutral.
- Gold Miners Bullish Percent is still much closer to oversold than to an overbought ‘sell’ signal. This is positive from a risk/reward standpoint.
- Gold/Silver Ratio is still constructive. If this follows through positive while USD fails we’d have a replay of the 2001-2003 period that launched a great bull market (which then took on bubble dynamics from 2003 to 2008, when the crash resolved that issue). If GSR follows through and USD does too, it would be bearish for many markets, likely including the precious metals in the near-term.
- The Seasonal Average for Gold bottomed in July, made an interim top in October, bottoms again in December and turns up hard into February. So despite today’s grind, let’s keep a December/January upturn potential in mind.
- The Seasonal Average for Silver bottomed in October, grinds around the lows into December and turns up like a house afire in January, topping in February, dropping in March before a marginal new high in April.
- Q3 Reporting was generally mixed with some miners doing well and others not. We had anticipated a potentially rough go of it due to the Gold/Oil ratio (GOR) and other bearish macro indicators during Q3, but it was not as bad as expected. The GOR has made up about half the Q3 decline in Q4. When Q4 is reported, the would-be benefits could align with a still positive seasonal in January into February.

Personal favored stocks are what I hold, AEM, AGI, EQX, SILV, OGNRF (OGN.V) along with turnaround play WDOFF (WDO.TO), which got hammered on its earnings. It’s a turnaround situation after all. It don’t come easy. AEM had a moderate earnings beat, as did AGI, SILV and EQX to varying degrees. It was only notable because it came during a phase of fundamental impairment (and not just in the Gold/Oil ratio).
Watch list items include BTG, KGC, NGD, EGO and MAIFF (MAI.V) with the latter also playing as a tax loss seasonal item in line with its bearish trend all through 2023 along with its index, the TSX-V.
As noted above, I am in absolutely no hurry to position. What I hold is the stuff I don’t want to take a chance on missing out on if the sector resumes a rally. But I will not add too much until either the sector breaks out (GDX above 31 or so) or fails the March low and eventually finds a buying opportunity significantly lower. I’ll also consider hedging on occasion as has been the case all year.
Commodities
An update on Friday noted that Palladium had finally crashed all the way back to anticipated support. I was trying to decide between PALL and related equity SBSW and ended up doing nothing. There’s always this week and beyond. But when you look at how far these two items have tanked, it’s hard to imagine a positive risk/reward investment not coming out of the situation at some point.
Here is a daily chart of SBSW, for example. It is not readily visible on the chart, but the tank job on Friday took SBSW right to the wedge bottom.

The weekly chart shows the basis for the support level that the wedge has guided the stock down to. Risk/reward? Beuller? Anyone?

Anyway, it is on watch along with other items (commodity related or otherwise) under consideration for tax loss season. The commodity complex has been beaten to a pulp with exceptions like Uranium and to a lesser degree Energy related equities (per the Trade Log I added O&G play, NOG last week as it has pulled back to near the SMA 200).
Going against the cyclical inflation trades, the weekly chart view of copper’s breakdown from the Symmetrical Triangle has gone from bad to worse, turning down from right under the nose of the Sym-Tri.

Just curious as to whether your local ‘commodity super cycle’ Twitter influencing chartist is bothering to highlight the pattern that the CRB index (daily chart) has taken on. All due notes about patterns being very secondary in TA, but if you’re going to highlight bullish ones, I sure hope you do the bearish ones as well.
Crude oil is of course driving that negative look to CRB. NatGas got pounded, but maintains its basing situation. I have AR on watch for that. Industrial metals did what copper implies, and got croaked back into the downtrend. The Ag index is trying to muster a decent bounce.

It is worth noting here that seasonals play a stronger role in the Ags and Soybeans, for example, rise (on average) from October to July. That’s one month in to a theoretical 9 month bullish phase. The daily charts of Soybean Futures (ZS) and the Soybean fund (SOYB) are constructive, although note that they are up near all time high blue sky as opposed to bombed out like so many other commodities.

With respect to the daily chart base in NatGas above, here is Gas having been repelled at the big picture (monthly) chart’s resistance area we’ve noted previously. The problem I have is that the seasonal topped in October. But if you’re a Gas bull, it is at a buying level, back in its base-making trend per the daily chart above.

The Uranium sector continues to hear its own drummer and march to that drummer’s beat. The 50 day moving averages have been ground away at, but thus far held. I’ll hold URNM if it holds the SMA 50 and I’ll keep usual suspects NXE and UUUU on watch, among others. The trends are up but still we cannot rule out a test of the 200 day moving average (not tested since July), which for URNM, is over 20% lower. I’ll be strict about the SMA 50.

Finally, the sad chart of commodity/resource producers and prospects, trending down and potentially setting up for some tax-loss seasonal plays at least. Patience here. MP and SBSW are my primary watch items along with the more speculative TLO.TO.

Portfolios
Savings balanced by gold
Trading Account: No positions
Roth IRA (non-taxable, no contributions)
Cash (and equiv.) is at 89%. Nice and comfortable for me. In line with the analysis above, I’ll either lever in more to a seasonal rally in areas that are working or I’ll raise more cash, collect income, sit on my hands and patiently wait for 2024’s opportunities. Makes little difference to me when cash is paying us to be safe.

Cash & income-paying Equivalents are at levels that are right for me and my real-world situation. Your situation is different. Cash will be adjusted as needed.
Refer to the Trade Log under the NFTRH Premium menu at nftrh.com for trade info, if interested (not that you necessarily should be). Also, you can follow at Twitter @NFTRHgt for notice of updates.
NFTRH is not to be distributed to third parties without prior written consent
Notes From the Rabbit Hole (NFTRH) is a weekly market report in which we provide analysis on financial markets. We make every effort to provide accurate and high quality content, but this analysis ultimately represents our opinions and these opinions are provided without warranty or guarantee of any kind. See full terms & conditions of service under the ‘About’ heading in the main menu.