
Summary
US Stock Market (last week): From here SPX will choose whether to enter a technical bear market (take out 3808.86) or simply fill the 3979 gap and put on a seasonal rally within what may already be a bull market having topped in July. If it does rally, such a move would come amid…
US Market Sentiment: …increasingly over-bearish sentiment. As yet not extreme but favoring the contrary bullish play, for a seasonal trade at least. Our best view for a tradable rally was originally for a hard corrective test, which could provide sentiment fuel to a similar, albeit lesser, degree to Q4, 2022. A “bull killer” over-bullish sentiment reading was registered last summer, however, and it was equally extreme to the “bull birther” a year ago.
NEW: SPX found support and spiked upward on Fed hawk relief. Over-bearish sentiment generally is now neutral and that bull killer still sits there as an indication on the future. Risk has risen markedly in the US market over the last week.
Indicators (as per last week): 10/2 yield curve steepening but pulled back a bit with last week’s relief. Libor/T-bill yields not indicating banking sector stress. High yield spreads eased on the market relief last week. Real 5 & 10yr yields also pulled back on relief from hawkish policy fears. Market breadth as measured by SPX ‘equal weight’ vs. headline is still very poor and indicating a coming bear phase. Gold/Silver ratio is elevated but not impulsive. All in all, indicators are fairly tame. This makes sense in transition to a more virulent macro. For now, Goldilocks is still hanging around.
Fiscal Inflation View (as per last 2 weeks): In my view, this comes later. Perhaps at the trigger of a deflation scare.
Global Stock Markets: Response to the negative economic/policy implications as USD drops? Global markets, quite anti-USD on balance, bounced. If USD continues to pull back perhaps more global areas like Asia/EM can get a good seasonal rally. As usual, watch Uncle Buck.
Precious Metals: Risks: War bid appears to have worked through gold and is now factored as gold has a more favorable sentiment risk/reward than stocks and commodities according to Sentimentrader’s amalgamated data. Technically, gold is constructive while silver is less so. But a little upside from here and silver could get quite bullish.
On the whole, the macro worm is turning toward the gold sector because it is also turning away from the age of bubble making. As for the miners, there is a shot at the GDX target of 40 on the current seasonal. But if that comes about it still may not be THE real rally. A lot will likely depend on what kind of pressure comes upon the sector as inflation fails for all to see, stock market relief turns back into angst, and the machines start selling everything.
Commodities: Per last week “Still little personal interest here as inflation continues to fade and the greater commodity and resources markets continue to tank.” While commodities and related stocks can get a seasonal play, especially with so many tax losses being booked, a disinflationary to deflationary environment is not positive. Indeed, with CRB’s correlation to inflation expectations, any seasonal plays taken should be nimble.
Currencies: Boom! A weak headline economic number and some downward revisions knocked Uncle Buck off his perch above the March high. It closed the week below the 50 day average. If this breakdown holds up we target the SMA 200 at 103.50 before evaluating the macro further. Global currencies – mainly in bear trends relative to both USD and gold – bounced on the news. Bitcoin is getting some speculative bidding and could also be a seasonal/tax loss play. But folks, it ain’t gold. It’s a speculation.
US Economy & Stock Market
As the Fed’s Quixote continues to tilt at his inflation windmill.

Here is Friday’s headline eyeball harvest:

A softer payrolls number triggers a continued celebration by relieved market participants and it is right on our plans of a) a seasonal bounce/rally and b) Fed relief and Goldilocks now and uncomfortably low inflation (i.e. deflationary pressure) later. Got to herd casual players back into stocks and what better time than the combo of a positive seasonal (on average), contrary bullish sentiment and a decelerating economy prompting dovish Fed hopes?
Meanwhile, this headline states the obvious.

Bad news for the economy is good news for our current seasonal bounce/rally theme. It will turn out not to be good news when disinflation morphs to uncomfortable levels of deflation. Hence, for now I plan to speculate for as long as I believe the seasonal is in effect, but on the whole continue to make like this gentleman, who knows one or two things about investing.

Within the weaker payrolls report we find a disturbing drop in Manufacturing and gains made in the usual SERVICES areas, which are add-ons to a productive economy, not drivers of it. Also, while positive, Leisure & Hospitality services job growth shrank markedly from previous readings. Of additional concern is that government accounted for the second highest reading within the net of 150,000. Talk about unproductive endeavor.

As if the above were not concerning enough, it is time to ask whether the trough in unemployment is over and an upturn is beginning.

We are on track to the theme originally planned a year ago as we were preparing for a bottom in broad markets and an oncoming rally. That theme went like this…
- Bottom in Q4, 2022 amid extreme over-bearish sentiment, the bullish mid-term election cycle (on average) and easing concerns about inflation and hence, the hawkish Fed. [achieved]
- Rally in 2023 led by Tech as a Goldilocks flavored macro (inflation not too hot or cold) ensues and market participants start to cheer the waning inflation monster. [achieved]
- With respect to the second headline above, the “good news” for the stock may (not will, may) persist through punch bowl season and perhaps well into Q1. [in progress]
- But a soft landing is unlikely in the volatile boom/bust cycles that have been hard wired into the system by decades of monetary manipulation as remote economic management. MMT? Ha ha ha, it’s TMM (total market manipulation). More likely is a full swing of the macro pendulum toward deflation and contraction as the seasonal rally ends, either sooner or a bit later. [projected]
- Later, with Treasury yields dropping hard, we will see what new inflationary combo of a debt spending government (fiscal policy) and a more dovish Fed (monetary policy) can cook up. [projected]
- The next inflationary operation is likely to be a dangerous and painful one because it would come without the license implied by the decades long downtrend in long-term Treasury yields and its disinflationary signaling, as visually rendered by our Continuum guide (below). [projected]
- In this case, a drop from 5% to 3% would probably feel like a drop from the now green EMA limiters used to feel (deflationary). But after such a drop and assuming the trend break above 3% holds, the implication is that there are less inflationary bullets with which to battle deflationary episodes if monetary regulators (Fed) and/or fiscal deficit spenders (politicians) try their old tricks again. [projected]
- Those tricks worked during the Continuum’s long and gentle decline. But the impulsive spike of 2022 implies two things; 1) a handle that will be pulled into a deflation scare and 2) after that, a still compelling picture that the macro signaling in bonds has rammed upward to a future inflationary trend from the previous decades of a deflationary backbone, against which policymakers routinely inflated. Could we flip the future narrative to “inflationary backbone, against which market forces routinely deflated”?
- The difference would be that the deflation episodes could be more severe than the mop up jobs Greenspan and Bernanke routinely did at signs of trouble. The main point here – especially if you are a gold stock bull – is that the bubble making routinely kept gold under wraps and downright impaired the gold mining sector. So we might also view the impulsive spike upward as not only a handle, but a sword that pierces the decades old bubble, ushering in an era when monetary policy will be less effective and it could be left to the fiscal stimulators in government, with little but a growing debt pile from which to spend. Either way, deflationary, stagflationary or in my opinion, both, may be in the longer-term offing. [projected]

SPX found a low last week well within the thick support zone as anticipated. If it takes out the early October high of 4393.57 it has a chance to grind that area and establish support for a longer rally. That of course assumes it’s not just on a mission to fill the gap left open at 4401 before failing again. There is, after all, a gap way down 3979. But that could also wait to fill when the bear market begins.
Had point 3 on the chart halted the correction at the SMA 200 with a ‘C’ to an A-B-C correction against the uptrend it would have been a normal correction within a trending and bullish view. The fact that it made 5 clear waves lower in my opinion makes the situation less clear. An A-B-C correction to a clear uptrend would have been a classic bullish precursor. The impulsive ‘Fed relief’ spike off of ‘5’ is something different. It looks like short covering, quite frankly. Watch point 4. Below it the post-July downtrend is intact. Above it things get more interesting for the seasonal rally.

Let’s now take a look at a weekly chart of SPX, NDX, SOX and DJIA. SPX has already qualified to have made a failed test of the all-time high. A near-term failure of the daily chart bounce above would increase that possibility to a probability. The weekly chart also advises a fledgling cross down of the weekly EMA 10 (orange) below the EMA 20 (blue). Notice how such crosses indicated an oncoming crash in 2020, a recovery a few months later, a top into the 2022 bear phase and last December a trigger to the 2023 bull phase. Well, it’s an early signal, but the EMA 10 is below the EMA 20 and that is a warning signal.

As for the other indexes, both NDX and SOX are correcting from what could eventually be looked back at as double tops. Same goes for the Dow.
With the ferocity of last week’s post-FOMC spike and the jubilation (well, short covering) about a weakening Fed because of a decelerating economy, I don’t like the setup. That spike was too much, too soon. There was no grind, no basis. Just pure endorphins (well, short covering). Last week’s events did not appear to set the stage for an extended seasonal rally. There was a hard low amid over-bearish sentiment and a bounce was due. It came, it was a good one. But it ended right where it should have ended in order to keep within a downtrend.
As such, I shorted SPX. I’ll be prepared to follow that train of thought and increase shorting into a bear market or abandon it if the seasonal rally starts making new upside. For now, cash is paying nice income and it will be the primary risk manager.
US Market Sentiment
Dumb money indicators ate the market on Fed relief and Smart money started to ease a bit. Short-term risk for stocks jerked into the red on the price spike. For the short-term at least, the contrary positives for the stock market have faded to neutral at best. While not necessarily overly adversarial, contrary sentiment is no longer a friend of the bulls.
Side notes:
- The weaker economic news pumped bond buying. *
- Gold, despite whatever is left of the war hysteria, is buttoned down and more pleasant from this contrary angle than any of the other assets shown. To put it technically, “hmmm….”

NAAIM (Investment Managers): We noted last week their extreme over-bearishness and sure enough, the market spiked in the face of that. As of Nov. 1 they were still very bearish at 29% bulls. That is a very bullish contrary reading, but 11/1 was FOMC day and NAAIM are probably chasing the spike now.
Investors Intelligence (Newsletters): Last 3 Bull/Bear readings were 2.32 > 2.06 > 1.67 (on 10/31), in other words contrary bullish after an over-bullish reading above 3 in July. But again, this was while market participants were cowering before the decision making of the great and power Fed of Oz. They also likely began to chase after FOMC.
AAII (Ma & Pa, individual investors): Still completely over-bearish (contrary bullish) on FOMC day (11/1) but likely to have increased enthusiasm with the rest of the players as relief swept the land.
Sentiment Bottom Line
Bulls have lost the decided contrary sentiment edge they’d had, as man, woman, they, them, machine and casino patron alike cheered the easing economy. This is in line with our plans for the seasonal rally. Suck ’em in before the bear gets going. But the spike indicated a panic to buy and it remains to be seen how sustainable the market rally will be. We are, after all, working under the rules of a larger “bull killer” already in place, per this Smart/Dumb graphic that is a little dated but shows the two pertinent signals.

* Speaking of bond buying, wouldn’t it be funny if my dumb guess about a top in long-term yields actually plays out? Then I can go apply for my card at the local Gurus’ union and tout my amazing abilities for… guessing!

Currencies
The US dollar buckled under the pressure of dovish Fed hopes. In failing the breakout from the flag and then losing the March high and the SMA 50, the southerly pull noted last week for RSI and MACD appears to be guiding USD lower. If that follows through, our target is the SMA 200 (103.50) at which point a hold and upturn by USD could signal an oncoming market bear (and liquidity crisis) and a failure, a stronger rally in global risk markets. For now, the SMA 200 is the target and if that is registered market risk will likely be high. But we’ll evaluate the situation in the context of the entire macro at such time if it comes about.

Global currencies are generally trending down but all of them bounced in the face of the hard USD pullback on Friday.

Note however that while gold pulled back in relation last week it is trending up vs. major global currencies except the Swiss Franc, against which it is constructive. This is a picture of a bull market that most of the world sees in gold.

Bitcoin’s weekly chart shows a break through resistance. This is tentative and could be an ill-fated suck-in for breakout/momo players if Tom McClellan’s thesis is on target (thanks to Mike M. for forwarding). But as yet it’s in breakout mode, weekly RSI is getting a bit overbought but MACD is healthy and primed. FYI, as I have no current interest, with other speculations ongoing.

As a side note, gold is still greatly under-performing BTC. This is in line with gold’s currently positive contrarian risk profile. This is not some competition like the one between those two heavily followed influencers/promoters on the former Twitter, taunting each other in their battle of the titans (of influence). It is a long-term monetary value instrument dropping in relation to a speculative new age thing invented to act as money for scamming old people out of their life savings, among other things. But I am an older person, so consider me out of touch if you’d like. BTC is a speculation. It is nothing like gold, even as some gold promoters sashayed on over to BTC at the BTC top because their gold promos were not working. But I digress…

Global Stock Markets (daily charts)
Please take due note that local currencies play a role in market performance for global citizens. NFTRH being American, cannot get too far afield managing all those moving parts with my simple charts. So global market comments and charts are for reference.
If the US market is going to rejoice the reversal in the US dollar, so too, especially, is the world (ex-US). Never should market management rely on TA alone. Never. Charts-only analysis is one part elixir, one part snake oil. That is the reason we slave ourselves to macro indicators (e.g. the USD and Gold/Silver ratio combo, yield curves, 30yr yield Continuum, etc.). With the strict inverse correlation of ACWX to USD, if USD failed ACWX was sure to put on a big burst. Which it did. Bad technicals be damned.

Everyone continues to generally trend down, but maybe some of these intermediate trends can be broken if the buck drops to the 103.50 target.

Japanese Nikkei bounced. No current interest. Hong Kong, Asia and EM are robo trending down. Possibly some seasonal interest if de-dollarizing BRICS players get a new – if temporary – lease on life.
India is still turning down. Canada’s TSX-V is still in the dumps, but USD willing there is a chance for a heck of a tax loss seasonal play up there among the Prairie Dogs, Tumbleweeds and Cow dung.

Brazil and Argy are relatively solid, technically. I make fun of an Argy bubble, but since August its stock market has done the right things where bleeding off some of the excess is concerned. If BVSP pop is real, it could look for a new high above the July high.
Mexico, Africa ETF and FM ETF are all just bouncing within downtrends.

Precious Metals (daily charts)
Before reviewing the chart of GDX I want to review a core point once again, because it seems that no matter how often I try to illustrate it, I am either confusing some people or they are listening to authority figures (influencers) out there with compelling but differing views to mine.
The only reason I see to have a positive big picture view on the gold stock sector is the “post-bubble” reason. The Bob Hoye Squirrel finally finding the nut for which he’s been searching for 20+ years. I write that affectionately as it is Hoye’s bedrock fundamental view – if not his timing – that long ago influenced my work. Referring to the 30 year Treasury yield Continuum chart above, if that impulsive spike is the sword that slays the bubble makers we have, by definition, a “post-bubble”. For 20+ years the usual suspects informed us that cyclical inflation is why you buy gold and hence, gold stocks. That advice was tragically wrong, fundamentally.
Whether under deflationary and/or stagflationary pressure, when gold starts to assert within the macro the time will be right, fundamentally. Gold vs. stock markets is more ‘macro’, more big picture psych and perception. Why own gold or gold stocks when you can own stock certificates that are much more profitable? The ratios to stocks impulsed up on war alarm, but that is being corrected nicely now as stocks get a relative bid on ‘Fed relief’ hype. I actually like this correction in these indicators.
Gold’s ‘real’ commodity adjusted price is still elevating and that is positive. This is especially true vs. mining cost input commodity, crude oil. Gold (counter-cyclical)/Copper (cyclical) remains constructive to continue upward.

With some of the war bid bled off the gold ratios are still in transition to a positive fundamental alignment for the gold mining sector.
Moving on to the daily GDX chart, we see that it remains below the SMA 200 after Friday’s hard rally. It filled the upper gap but not the lower one from October 10. Obviously, GDX does not currently appear to have its eyes on the lowest gap visible on this chart. Bottom technical line here is that if GDX takes out the resistance and the SMA 200 and holds them, it will be targeting the red neckline and the July high and ultimately, new highs for the cycle that began a year ago (target is 40).
However, even if this bullish potential plays out please be aware of a situation where a broad market failure/crash could get the inflation bugs selling en masse before the real and sustainable post-bubble bull move takes place. Just asking for perspective. One thing at a time. If GDX breaks bullish here we will be looking for new highs above the May high. That would be a heck of a trade, anti-USD though it would probably be. Beyond that we will refine future analysis as macro inputs come in.

Gold sits constructively at support after breaking down but holding the key support zone and bear trapping upward.

Silver sits not so constructively just below resistance, dealing with the moving averages. However, RSI and MACD are positive and oh so sneakily not overbought. If silver were to break this resistance level there could be some upside hysterics. If a speculative and anti-USD rally takes hold, it could be led by silver and it could be powerful. However, the Gold/Silver ratio (GSR) is still bull biased and the USD has not conclusively broken down. So let’s stay balanced until that changes. Here we reference back to the 2001-2003 period when the Gold/Silver ratio rose and USD declined. That was a purely bullish environment for gold mining. Why not a phase like that now? That phase instructs that USD and GSR do not necessarily HAVE to run together.

I increased some positions and added a new one (BTG) due to the potential that the post-May correction may soon end. If that plays out I’ll plan to add more. If it proves wrong, I’ll hedge/sell or do whatever is needed to patiently manage risk. But if a Q4 seasonal rally plays out it could make our year. We’ll save the 2024 macro – and its potentially phase changing post-bubble aspects – for… 2024.
Commodities (daily charts unless otherwise noted)
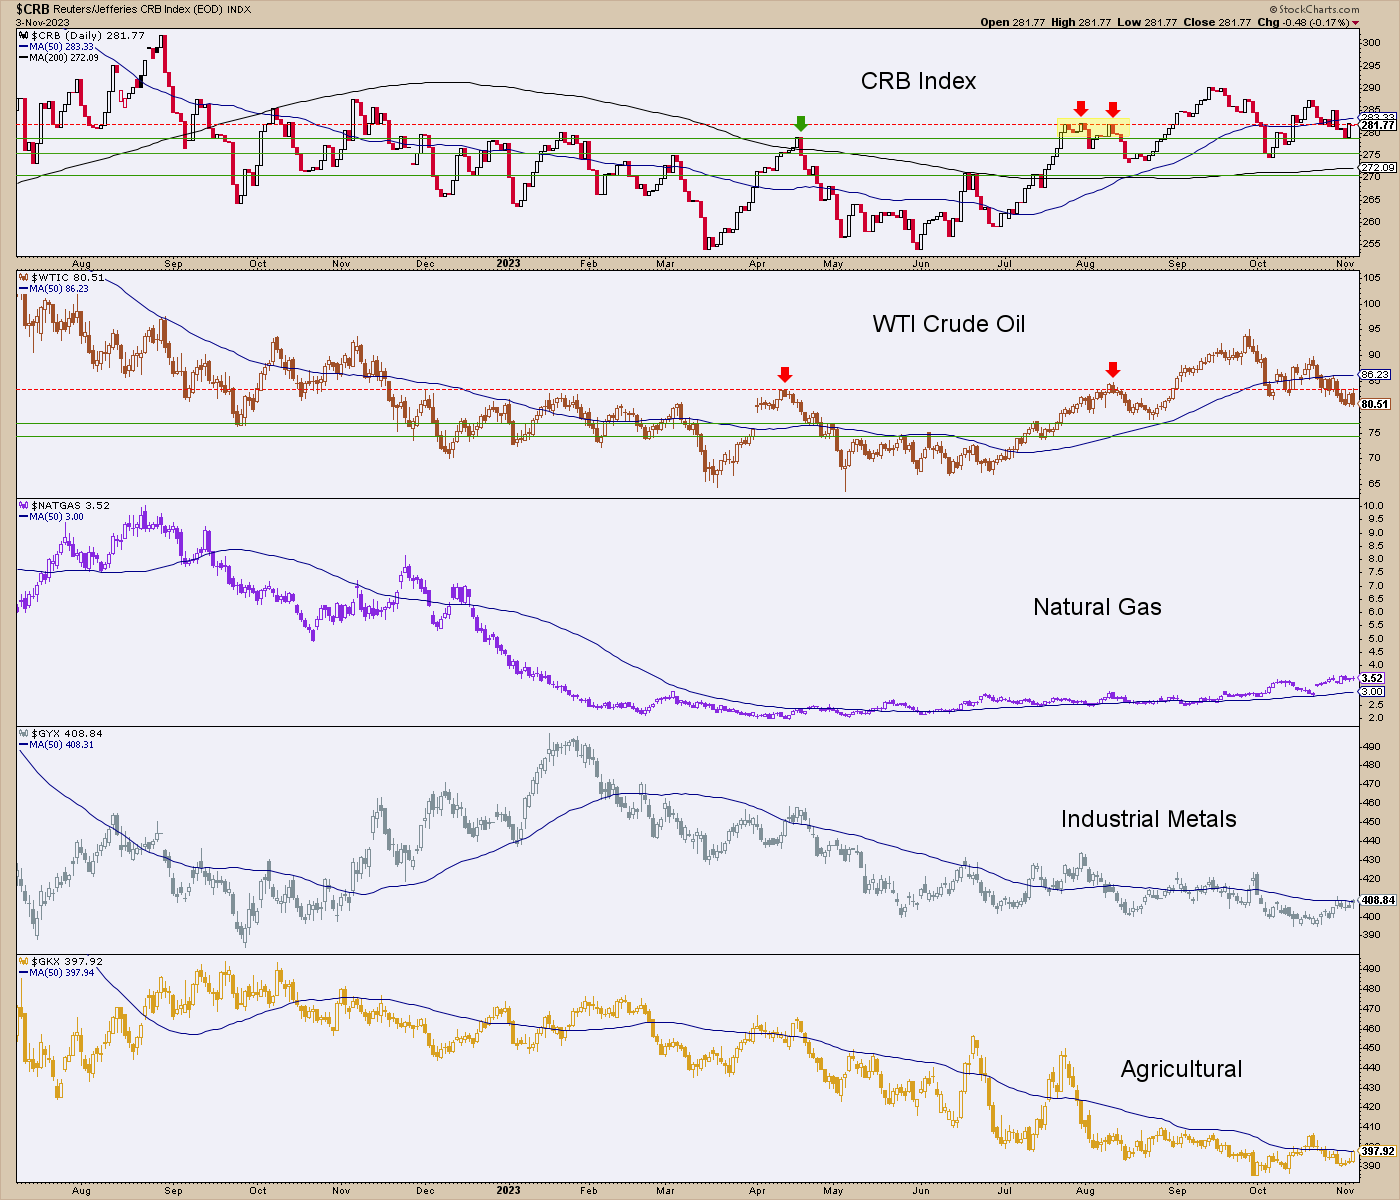
Let’s think about this for a moment. If the public is getting relief from its inflation/Fed fears because job creation is slowing and the economy is decelerating, is that positive for commodities, even as an anti-USD trade with the buck losing fundamental support? Maybe. But in a contraction environment gold should rise vs. cyclical and inflation sensitive commodities. We have shown in the past that the CRB index tends to travel in alignment with inflation expectations. So if a broad seasonal rally unfolds due to relief from such expectations, well, follow the logic. Commodities would not be favored.
In the case of this chart, those commodities should decline relative to gold in such an environment, and they are. Anti-USD rally or not, commodities are not favored and will not be favored until some fiscally inflated cycle takes place in the future.

CRB index has taken on a sloppy shape as has oil. H&S you say? Possible. But caveats about patterns as TA hocus pocus. Gas is still constructive in its base. Industrials metals are not good. Nor are the Ags.
As to the industrial metals, Doctor Copper (weekly) is putting on a bit of a ‘Fed relief’ bounce. It is either vulnerable to failure here at the underside of the Symmetrical Triangle’s nose or the bear case is vulnerable to false breakdown and a bear trap scenario. Why not let it play out before speculating? At least that’s what I ask myself when considering copper stocks like FCX, SCCO, ERO, etc.

Once again, the big picture (monthly chart) of Gas showing that the daily chart’s break upward has bonked Gas’s head up against resistance. Break through and it could put on a laser show. Fail, and it could dent my AR position.

Over in the Us, the sector is intact to its rising 50 day averages. Despite this, I took the profit on CCJ, but held NXE and UUUU. I’ll plan to do that as long as the SMA 50s hold up.

Much like the note above about commodities in general amid waning inflation expectations these commodity related stocks are relatively weak. Boy are they weak. And for the same general reasons as noted above. That reasoning being that they are cyclical and commodities are related to inflation expectations. You could say that items like these have been forecasting disinflation>deflation for some time now.
That said, a seasonal tax-loss relief rally is quite possible. You’d want to be nimble about it though.

Portfolios
Savings balanced by gold
Trading Account: No positions
Roth IRA (non-taxable, no contributions)
Cash is 84% with one short position against longs favoring gold mining and Tech. I increased gold miner positions not on technical confirmation, but on macro fundamental news implying economic easing and by extension, waning inflationary effects. Same reasoning can be applied to Tech. Not that the two will remain tethered, but for this phase at this moment I think they may be to a degree.
DVAX, which is subject to the Bio/Pharma sector was added back. I missed GILD, which was noted a couple weeks ago as a target within the Healthcare/Value stock realm. I am keeping Healthcare in mind as it is more defensive and oversold and at a potential low in relation to broad SPX.
But give me a reason to raise cash, increase shorting or otherwise manage risk and collect income and I’ll take it. It’s just that the prospect of the GDX target at 40 is too compelling to not be sitting with some increased gold stock positioning.
As for the other stuff, it’s dangerous out there. Sure, I’ve done well with things like ANET, MSFT and MRVL. But I got hammered on a spec in FTNT and one in the still held AEHR. It’s very hit and miss out there in Tech land, and that does not bode well beyond the seasonal.
Okay, let’s wrap ‘er up. Lot’s of talking. So little time. ;-)

Cash & income-paying Equivalents are at levels that are right for me and my real-world situation. Your situation is different. Cash will be adjusted as needed.
Refer to the Trade Log under the NFTRH Premium menu at nftrh.com for trade info, if interested (not that you necessarily should be). Also, you can follow at Twitter @NFTRHgt for notice of updates.
NFTRH is not to be distributed to third parties without prior written consent
Notes From the Rabbit Hole (NFTRH) is a weekly market report in which we provide analysis on financial markets. We make every effort to provide accurate and high quality content, but this analysis ultimately represents our opinions and these opinions are provided without warranty or guarantee of any kind. See full terms & conditions of service under the ‘About’ heading in the main menu.