
Another Positive Interim Macro Signal
Last week we noted two market leadership signals, one positive (Semiconductor and Tech leadership) and one potentially negative (Healthcare relative to the broad market). The potential bottom in the XLV/SPY ratio looks like less of a potential one week later (positive for the markets) as the would-be low got bent out of shape, and Semi and shorter-term Tech leadership are still intact.
This week let’s look at a signal showing that the stresses of 2022 continue to ease in 2023. Very clearly high yield bond spreads are not indicating a rush to safety or liquidity crisis of any kind yet. In other words, from this vantage point the Q4-Q1 rally theme lives on. The 2020 spike in the spread logically came with a deflation scare and the 2022 bear market began in conjunction with a grind higher in the spread. Currently it is one tool telling us that it’s still okay to speculate long and not yet okay to speculate short unless you, unlike I, have the stomach for shorting against an intermediate bull trending market with intact signals like this.

Back in November I labeled the projected broad rally the “Q4-Q1 rally”. It was projected and born of wildly bearish sentiment, projected inflationary relief and by extension Fed hawk relief, and the post-election pattern, which is positive on average over the next year. What we’d want to do is use a picture like the above to a) realize that an unbiased view of the situation shows an intact and beneficial backdrop from an important macro indicator, and b) to be on alert for any changes in status of this and other indicators (one biggie that comes to mind would be a future reversal from inverting to steepening of the 10-2yr and other yield curves).
Bottom Line
The High Yield Spread indicator is currently beneficial to the US based components (at least) of the broad stock rally. If this and other beneficial conditions endure, the rally should endure. And just because I labeled it the Q4-Q1 rally months ago does not mean it cannot extend beyond March. But we’ll let a host of indications (e.g. technical, sentiment, macro) guide as usual.
Meanwhile, speaking of the yield curve, let’s leave the segment with the long-term view shown last week. The curve is inverting ever deeper and it is not usually the inversion phase when the fun* begins; it is when the next steepener begins that we will see upheaval in all the pre-programmed thinking by today’s market players; man, woman, machine, Ma, Pa & casino patron alike. So this line burrowing southward can be interpreted as aligned with the gentle downtrend in the High Yield spread above. It’s when they conclude their downtrends that the action starts.

* Fun defined here as mayhem, which may well be fun for some who’ve prepared the right way, but will be painful for many more.
US Stock Market
Do you know why so many people are annoyed right now? Well, my interpretation is that the rally out of October has been a grinding and somewhat volatile affair. It can be especially questionable when an index like SPX is trying to change its trends and attract bottom feeders. Being a bottom feeder is a more difficult job than following an established trend and simply buying the pullbacks.
So there has been a lot of grind since the October low and last week SPX dinged the SMA 200, held above the key 3900 support level and in taking out the SMA 50 on Friday made a nice signal (if it’s not summarily reversed on Monday), which would be consistent with the mean spirited nature of this particular market phase. However one thing we can say for sure is “intermediate rally technically intact”, as labored as it’s been.

Within this broad intact situation we have Semiconductor leading Tech (and SPX) since October and Tech leading broad SPX in the new year. That is as we’d like for a supportive internal situation. So Q4-Q1 implied roughly another month of allowance for the rally. It could end sooner, it could extend and revise its name to the Q4-Q2 rally and go on to fail these into the next bear market leg… or it could flash “bear over!”
Right now we don’t need to guess. We’ve just closed another week at intact status and if this implies higher levels to come the next objective is the open 4219 gap.
Stonk Charts
On Friday an update reviewed the daily charts of four stocks I added (AMD, NXPI, PLTR & MSFT) to show what I – traditionally a bottom feeder in my best suit – was looking for in the charts. I want to pop up a few more charts of items from different sectors that are on my watch list.
A couple Semi manufacturers were added to the existing position in premier Semi Equipment stock AMAT, but from here on insofar as I’ll add more Semi I’d want more in the Equipment space. LRCX has a sweet chart with its golden cross of the moving averages, an obligatory downturn after that cross and now a situation where the price is shimmying up along the SMA 50. It’s a decent looking flag. Another note is that in 2023 up volume has significantly exceeded down volume, which indicates buying pressure. You know, charts like these bottom feed/potential trend changers fail all the time, but if they were women they would be my type. Not overtly sexy, but more reserved and even a little mysterious about what they hold for the future. Yes, I need to get out more, but I work 7 days a week. :-(

Switching gears to an inflation trade (copper) we find miner FCX reclaiming its intermediate uptrend after shaking me out and then spilling downward from the SMA 50 in what looked like a whipsaw to bearish, only to see that get whipsawed bullish. Mean spirited market? I’d say so. FCX has reclaimed the intact status after not making a lower low. I have it on casual watch simply because I am looking ahead to the idea of governmental (likely global) fiscal policy inflation to reconstruct Ukraine and other battered parts of the world. Remember that inflation is served two ways; 1) monetary, through bond manipulation and 2) fiscal, through debt spending. It’s all just like magic in a Keynesian system.

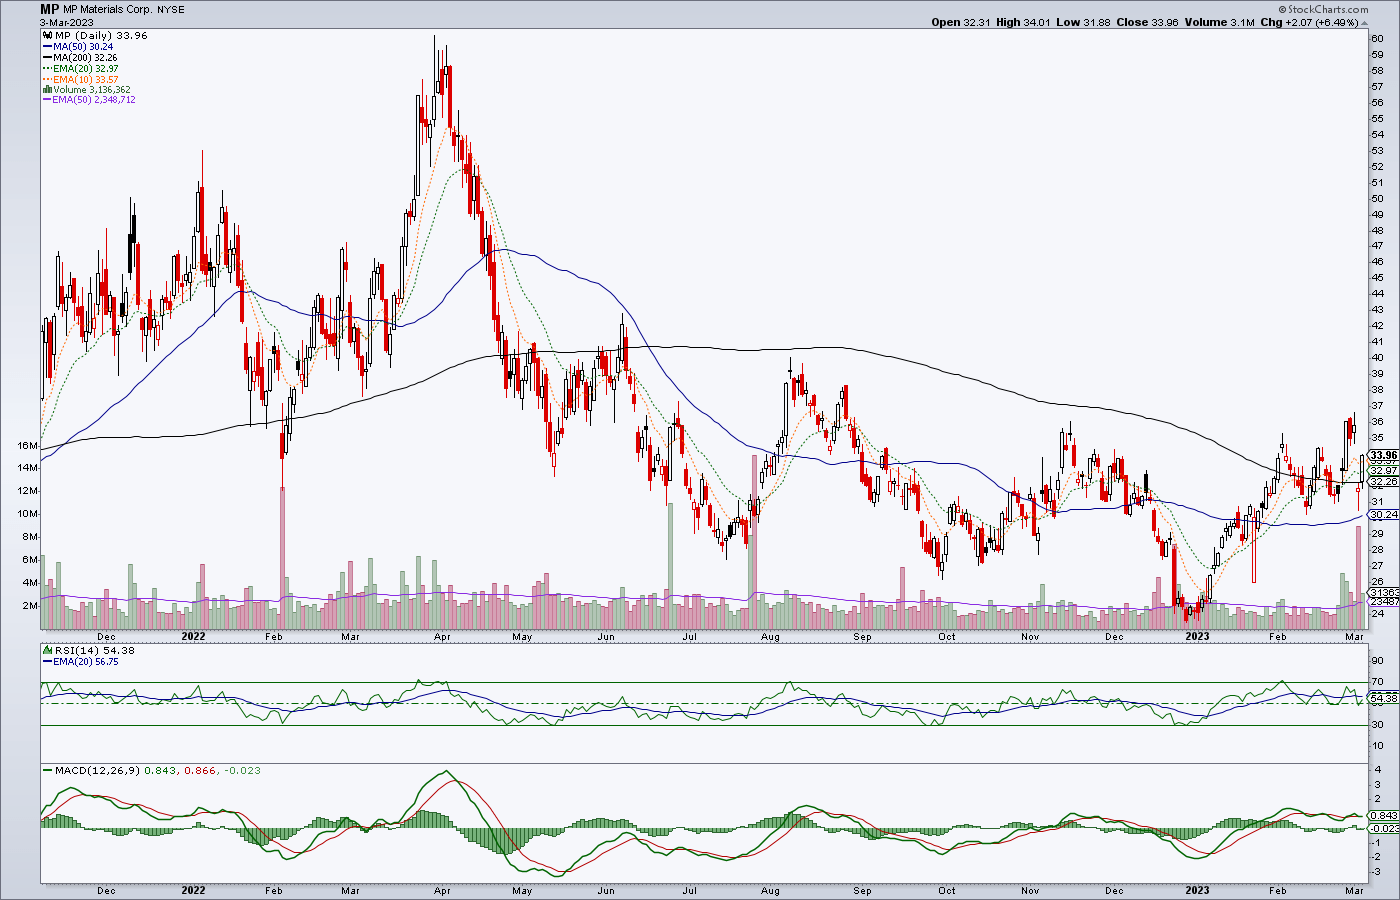
Another play on strategic materials for the future is MP Materials, a US based producer of rare earth elements and other critical materials for electronics, clean energy, defense and industry. In a post-war landscape there will be demand for this stuff. In an increasingly acrimonious China-US relationship, having a company like this on US soil would be strategic indeed. MP popped on earnings, got hammered back down and then I added it. The trends are sloping down, however. So here is a reminder that I am not a 100% chart robot. I have fundamentals in my brain as well. But I do use charts for setting objectives, tolerances, etc. This is the type of stock I’d poke at over a period of months or even years in order to be with it when the time comes for real. I’d like to see it hold the SMA 200, which it took back on Friday.
Here is a picture of a Cloud storage stock (casual watch item) that did not hit analysts’ projections at earnings, although its business is still fine, despite softening. BOX tanked all the way to the firmly uptrending 200 day moving average. It’s interesting, at least. Especially if the Q4-Q1 rally has some decent legs to it and if we start getting some nicer words coming out of the Tech sectors (what we’ve had to date are some areas like security doing just fine, but others, especially big Tech, dumping employees due to projections of a softening economy. So most of these and other prospective charts should be considered along with the wider macro view. Taking the BOX chart in a technical vacuum, the higher low and thus far hold of the SMA 200 implies a buying opportunity for a BOX bull. It’s also got a hard ‘stop loss’ below the previous (January) low.

Then there are the likes of this weekly chart of ANET. I don’t know what to call the shaded pattern, other than bullish. As I recall ANET beat on earnings and had good guidance. It’s a Cloud enabler and has the sexy AI buzzword going for it as well. As to the pattern, some TAs might call it a “complex Inverted H&S” because of its 3 shoulders (and counting). But an H&S forms as a reversal pattern at the end of a trend. If this is a bullish pattern it would resolve as a continuation pattern, not a reversal. Anyway, I’ve got it on watch after letting something similar get away with main Materials sector watch item CBT. It’s definitely not a bottom feed and so I am less comfortable buying things at their highs. But there could be room for one or two such situations.

With the likes of copper recovering, Natural Gas bouncing, Oil robo-trending downward but with a potential to bounce at any time and other commodity areas possibly due for relief if/as the Q4-Q1 rally labors on, I am keeping Uranium stocks (SRUUF, NXE, UUUU, URNM, etc.), Lithium stocks (ALB, LTHM) and even some energy stocks on watch (I am long NOG and short OXY and I’d expect one of those to be gone soon enough).
On the subject of Energy, I was asked to provide a chart on NatGas. Short-term it is crash city but bouncing. But I think the longer-term chart is more instructive. Gas dropped nearly all the way back to the levels we noted in 2020, which were testing support levels dating back to the 1990s. I personally messed up a trade in Gas vehicle UNG (which has been tracking Gas reliably over the last 2 years, as is not historically always the case). As you can see, risk/reward is positive based on proximity of price today vs. a few months ago. Now, if you’re a fundamental Gas bull, you are bolt upright and paying attention.

Personally with respect to the above, I will probably keep an eye on items like AR for any signs that it may start to break its downtrend and play it that way. Currently held NOG is an indirect Gas (and Oil) play as well.
If/as the rally moves forward I’d like to do more stock talk and less index/macro talk. It’s just that at times of question, times of grind and volatility, I have to put a lot of work into figuring out the nature of the environment and less into the vehicles with which to play the environment. So if the rally continues on, the above pictures are some of what I find interesting.
Global Stock Markets (daily charts)
The World (ex-US) ETF is trying to reclaim its SMA 50. Importantly for most stock markets, but more importantly for the average global stock market the US dollar halted at 105.35, below our target of 106.54. Could the buck’s rally have ended? Possibly. But its price is in an orderly consolidation that could be a flag prepping for higher levels, including our target.

Anyway, let’s grab an updated look at a few markets in ratio to the US S&P 500.
Europe/US maintains its intermediate uptrend despite a lot of up/down grind lately.

German DAX is even firmer in its intermediate uptrend vs. SPX and is turning the major daily trend up as well. This seems important or at least notable going forward.

UK/US is still bulling along as well.

Australia/US is still trending up, but boy is it grinding those moving averages.

Canada Senior continues to trend sideways with a bullish bias vs. its neighbor to the south.

Canada Junior… okay, this is interesting dear Junior mining speculators. While still on a major downtrend, CDNX/SPX is making a move on the SMA 200 and considering how bludgeoned da ‘V’ was, it’s at least a constructive view for the near-term with regard to the possibility of commodities, resources and other more speculative inflation trades possibly participating if/as the broad rally continues on.

Brazil on the other hand, is not looking good at all relational to the US market. So there’s one positive for the resources trades and one negative with these two charts. I put more weight on what the TSX-V (above) is doing with respect to extrapolating outcomes for the wider commodity/resources space.

Mexico… ah Mexico. What are you doing down there? Whatever it is it is still bulling your stock market vs. that of the hegemonic behemoth to the north.

EM is still impaired by the strong USD. Side note: I have EM income fund TEI on watch after previous sale. It is dropping toward what I think will be a buying opportunity.

India/US is in danger of rolling over as it clings to the major uptrend marker, which it obviously needs to hold.

Japanese Nikkei could be sneaky good here. It’s relational thing with SPX made a small bottom and is trying to take back the major trend marker (SMA 200).

Hong Kong/US is about as neutral as you can get and still in consolidation under a strong USD as are other parts of Asia (and EM).

Precious Metals
Note: an important sentiment guide for the precious metals (and other commodity, bond and stock markets) is still not functioning due to a cyber security incident. That would be the Commitments of Traders data (CoT). CFTC advises that they expect this issue to be resolved my mid-March. Meanwhile, we fly blind from this perspective.
Once again we did some work during the week via updates. Here are last week’s NFTRH+ updates on the precious metals. Friday’s update brought us up to the minute with the status, which is starting to look like a short-term bottom was put in (or at least it shows a sector that did all it needed to do for a healthy correction in the metals. The gold stock correction went a bit deeper than originally anticipated, but in taking back the respective daily SMA 200s are a candidate to have perhaps ended the correction (at a low of HUI 210, above preferred support at 200-206). Let’s look for follow through or lack of same. Otherwise, keep HUI 200-206 in mind if the correction has one more leg to finish dispiriting the bugs.
Gold and Silver daily chart technical status (& HUI discussion), Feb. 28
Gold and silver (and a note on the miners), March 3
As to the daily GDX chart we used to guide us into the correction we look for guidance on the way out. I just ran a Fib retrace level (not shown on this already too busy chart) that indicates GDX put on a 62% Fib retrace below the SMA 200 before bouncing. A head fake below and break back above a marker like the SMA 200 is all too normal, especially when the price had a mission to fill a viable objective like the 62% Fib.
In taking back the SMA 200 it also took back our previous downside objective for a normal and healthy correction. Hence, should the sector be prepping a real rally leg here (objective for now is a higher high to January, but there are still gaps hanging up there like rotting fruit) there is little technical baggage standing in the way now (other than that creepy lower probability gap down at 22.72, which may well be a breakaway gap not destined to fill any time soon).
Bottom Line on gold stocks: Follow through needed and an eventual takeout of the SMA 50 around 30 would set things on a course for new highs for the cycle out of Q4, 2022. But until the SMA 50s are generally taken out and held what is happening now is a bounce.

A few miner (daily) charts. Royalty charts are not shown (except for OGN.V/OGNRF which I hold) but the favored ones are RGLD, WPM and pending a look into recent issues at one of its royalties, FNV. Maybe OR as well.
AGI was held through the correction. It poked below initial support and right back above it. Take out the SMA 50 and it could get on its way.

AEM felt the profit taker’s axe on the correction. But now it is right back on watch as one of the few large miners I’d like to have (also watching KGC, NEM & GOLD). I was close to buying it on Friday but bumped up my MAI.V/MAIFF position instead.

Speaking of MAI.V, the position was increased due to no chart rationale at all. The chart sucks. It was due to the fact that I felt like creeping the sector a little in the event that last week may have been a real turning point. One day, buying the right stuff on downside opportunity could leverage a lot of profits with patience and luck.

BTG is held after buying the tank job after it announced the acquisition of SBB.TO. SBB is not a big reason why I bought it but it’s a prospective property way up north and by all accounts “the Clive” is a shrewd operator. I want to avoid doofus CEOs and management if at all possible.

MAG along with other silver stocks are on lower priority watch simply because silver dropped so hard and moves well enough on its own as to dissuade me from being too heavy in silver stocks and their operational risks. Indeed, I am not sure why I did not buy PSLV last week. But MAG is trying to bounce from a last ditch support area and oversold condition.

NEM is a big, bloated senior encompassing its former self and the former Goldcorp. It’s on watch simply for its ding of very clear lateral support. Not a great chart, however.

ORLA was sold, bought and sold again. It has been good for that. But with its former Gold Standard Ventures properties in Nevada in tow, I think it has a future as well. So I want to keep it on close watch. For example, if the sector really is ready to begin the next rally this thing could take out resistance and be gone. Or it could continue to robo-grind upward along the SMA 50. It did not suffer the sector’s downside volatility and who knows, maybe it will not get as much excitement to the upside. Here’s the thing though, the implication is that ORLA is in steady and committed hands.

OGN.V/OGNRF goes its own way and that way is currently sloppy sideways after breaking upward. I should try to remember to put a support line right around .50. That is what is supporting the consolidation.

Ending with a couple of silver stocks, SVM is sneaky bullish here, reclaiming the SMA 50 after not dropping as hard as some others. SVM also has base metals. It mines in China and these aspects imply the need to study the situation for a better fundamental view. But going by the chart, it’s better than many other silver stocks and to boot it’s got RSI ticking green and MACD triggering up.

SILV (also has a gold component) is in a tiny little would-be bottom/bounce pattern with MACD triggering up. Not bad. As for the big pattern, “complex” noted on the chart is a joke. It’s me making fun of TAs who use that term to sound technically mysterious when really they are describing a malformed mutant that grew an extra hump where it shouldn’t have. Bottom line: SILV is on casual watch, but not for the now mutated Inverted H&S.

Commodities
The CRB index forever consolidation continues. Inflation expectations (RINF is a handy gauge) have bumped up recently and if that continues maybe CRB will finally get a rally instead of these endless up and down pokes.

RINF daily chart with CRB shows the correlation between the two and the recent upside divergence by RINF. Of course it did that in 2022 as well and CRB did not follow. So let’s not get too excited. Let’s just coldly note something we see and factor it.

Energy Commodities: Crude Oil is much like CRB, riding its intermediate downtrend and turning the SMA 200 down. But like CRB, it has also popped back above that downtrend marker (SMA 50). NatGas was reviewed earlier in the report using a long-term monthly chart. Short-term it’s on a bounce. Long-term its in general buying opportunity for long-term investors.
Copper & Industrial Metals (GYX): Copper broke out. Copper broke down. Copper recovered. Come on Doc, shit or get off the pot! Seriously, it’s annoying. GYX continues to be less promising than its headliner, copper. But today copper is intact to its intermediate uptrend and GYX is suspect below its SMA 50. Copper miners as represented by COPX have taken back the daily SMA 50 and the intermediate uptrend. Battery metal Nickel has been rolling over and hit a new 2023 low last week. No current interest in this segment (TLO.TO/TLOFF is my main watch item) but always on watch.
Agricultural (GKX): The Ag complex itself is very suspect technically, with GKX below both the SMA 50 and SMA 200 and the SMA 200 rolling over. Yet a couple related stocks, MOS and NTR, made upside moves. One (MOS) looks impulsive to the degree it could undo the downtrend and the other (NTR) made spike up to test its SMA 200 from the underside. Interesting and worth watching both of those stocks.
Uranium: I added back u3o8 fund SRUUF and would plan to hold it as long as it stays above its daily SMA 50. U stocks are still generally floundering and/or technically messy. But I have an eye on NXE, URNM and UUUU as usual. I’d be happy enough with just adding more u3o8 as well. Let’s see the sector live up to the deafening hype about it out on Twitter. I get the long-term supply/demand funda. But the U heads have a way of sounding like Uranium is always just about to blast off.
Li, REE, Pd & Pt: Lithium price (as quoted in CNY, currently 362500) has tanked below the support shelf noted last week (see chart & rationale below). It is still well elevated from 2021, but the recent volatility in ALB and LHTM obviously indicated this decline. There is no support until 200000. Of the two primary watch list items, ALB has the better chart currently. But I am keeping them right there, on watch, for now. I did add Rare Earths (REE) watch item MP on a big drop back to the moving averages. It is technically trying for – but not near completing – a change of trend and REMX is firmly though gently trending down. Palladium has a busted chart and Platinum is pretty much doing what silver is doing, which is trying to find support at a logical support area.

Currencies
USD is lurking below our target roughly at the 38% Fib retrace level and 200 day moving average (currently 106.33). It is lurking in a flag, which is a consolidation of the bounce so far and could imply another ping upward to target. The Gold/Silver ratio (GSR), which often attends the USD (in this case it led USD as we gauged the positive divergence prior to Uncle Buck’s rally in January), is still aloft and above its 200 day average.

This combo should imply pressure on inflation markets and indeed many of them have been pressured (including the precious metals and its massive inflationist contingent). But the bounce in USD and rally in GSR have been moderate compared to what they would be if they rise impulsively and wreck the macro.

A firm US dollar and a non-impulsive GSR can also mean something more pleasant on an interim basis. Yes folks, it’s our old porridge pilfering friend, Goldilocks. This is why, short of things getting off the hook deflationary, I favor Tech and other stuff that does not favor inflation, rising yields and a weak USD.
To review for newer subscribers, USD is the global asset market counterparty and the Gold/Silver ratio is a monetary metal with more counter-cyclical utility divided by a part monetary, part commodity metal with more inflation sensitive and cyclical aspects. When USD and GSR rise impulsively together the indication is deflationary liquidity loss. But when they are gently rising (as occurred for much of the 2014-2019 phase) together Goldilocks can get bid. I am not pumping Tech stocks (or any stonks) here, but I am pointing out various interesting charts and noting a possibility based on historical reality.
Market Sentiment
- Smart/Dumb money indicators are aligned as shown last week. Sentiment has pulled back sufficiently to launch a new rally leg, which had to happen or technical parameters would be broken. With Thursday’s reversal and Friday’s up day that may have begun. That little expression of positivity did however jerk Sentimentrader’s very short-term indications to higher risk. Those S/T indicators are too skittish for me and are likely purely for day traders.
- NAAIM (investment managers) were pulling back hard as of March 1, before the end of week bounce. The pullback in NAAIM sentiment was similar to that of Dumb Money above. It pulled back far enough to launch a new rally leg. So far, it’s on script.
- AAII (Ma & Pa) were on plan with Dumb money and NAAIM with a sharp pullback hard enough to refuel the rally, but not back to bleak, forlorn or terrified levels.
- Investors Intelligence (newsletters) took a pullback prior to the end of week bounce as well. But their move was not so dramatic, as is often the case with newsletter boyz ‘n girlz, who prefer to write news that is more stable for their readers as opposed to what individuals do with their money, which is often to react.
Sentiment Bottom Line
Last week we described a situation where sentiment and technicals were aligning to either hold and renew the rally or end it. This week the move was to hold the rally. But follow through will be needed in order to conclusively renew it. Was Friday a fake out prior to a bear market resumption? Could be, because this is one mean spirited market. But going by the indications the plan is that the Q4-Q1 rally is intact with technical and sentiment parameters having thus far held.
Portfolios
Note: Accounts are balanced by gold, as has been the case since 2002.
Trading Account: Short OXY, based on chart. Giving it a little room to bounce, but Energy sector as a whole is intact and indeed I am still interested in NatGas and hold NOG. Otherwise, this small account is just sitting on its hands, not wanting to short the market or otherwise play games.
Roth IRA (non-taxable, no contributions)
Cash is all the way down to 85%. I am being ironic there. But not really. Each month cash spits out increasingly pleasing income while the whipsaw market chops, grinds and readies its next move. The tick down in cash is in alignment with what is noted in the opening segments and the Sentiment segment. Sentiment reset to the degree needed to re-spark the rally while the technicals pulled back to limits but remained intact. I have a ‘Goldilocks’ sort of feeling about it for now.
As for the precious metals, they are not unique! Please, deprogram the gold bugs and even the bug I appreciate, Bob Hoye because, with reference to the High Yield spread shown in the opening segment along with still inverting yield curves, a post-bubble contraction is not yet indicated. I will have none of this gold bug b/s of having readers obsess on a sector that is nothing special (yet). Frankly, I can make more sense of the charts for the Semi/Cloud/Tech stuff from a bottom feeder perspective. Gold stocks tanked to and through preferred support and have bounced. But they are nothing special as yet fundamentally and need to take out key upside objectives after taking back the SMA 200.

Cash & income-paying Equivalents are at levels that are right for me and my real-world situation. Your situation is different. Cash will be adjusted as needed.
Refer to the Trade Log under the NFTRH Premium menu at nftrh.com for trade info, if interested (not that you necessarily should be). Also, you can follow at Twitter @NFTRHgt for notice of updates.
NFTRH is not to be distributed to third parties without prior written consent
Notes From the Rabbit Hole (NFTRH) is a weekly market report in which we provide analysis on financial markets. We make every effort to provide accurate and high quality content, but this analysis ultimately represents our opinions and these opinions are provided without warranty or guarantee of any kind. See full terms & conditions of service under the ‘About’ heading in the main menu.
Gary, you have explained before how the PM complex can be the first to come out of a crash, a la March 2020. I cannot recall now how it could be an outperformer in other circumstances. Could you refresh us on this potential path?
The reason I ask is that silver and gold technicals look pretty good – poised for a period of outperformance lasting perhaps a Q, and with very attractive 20 year charts. But the broader markets don’t look particularly crash-prone on a 6-12 month view – tech and semis especially look strong. It is hard to imagine a crash in the broader markets. Can’t figure out how this foots with the PM complex.
It is the reason I am calling gold stocks “nothing special” at this time. And based on the last many decades they have been nothing special (or worse) way more often than not. The miners will leverage gold’s standing within the asset sphere. With gold, silver, stocks, commodities all rising, elevated or not broken down significantly (big picture wise) the backdrop is not right for a discrete gold stock view or a discrete gold and silver view. But in the right situation, a real change (crash) in the macro could drub the miners, flatten gold and kill the cyclical stuff. It’s from those ashes that gold stocks would be a buy, even if gold does not do great things to the upside.
It’s when we lose the ‘all one inflated boat’ mentality and gold holds value while the miners leverage that hold of value. I don’t see it yet, but the first two graphs in this report, among others, could reflect such a scenario when they one day reverse from down to up. None of this is to say that the PMs can’t continue to rally with the broad macro or even lead it. We might want to watch for gold/silver/miners to start to lose momentum within the wider rally for signs of termination on the broad rally. In that scenario the next correction (violent or more moderate) could be the final one before a big miner bull and gold out-performance come about. I’d have been looking at this most recent correction that way if cyclical markets had not (thus far) held support and intermediate trend (and as you note, Semis and Tech looking prospective).
Hence we should watch indications like the HY spread, Yield Curves, etc.
This is funny. Reputable institution backed by state government of first-world country. Mainstream media report.
https://amp.abc.net.au/article/102048622