
Admin Notes
I am still getting used to the modern WordPress post editor I’ve forced myself to start using. So if you can bear with any glitches, learning curves and/or inconsistencies to follow I’d appreciate that. I resisted moving into the modern era as long as I could before finally relenting. I just loved the straightforward ease of the classic WP editor, but the tools available on the newer block editor are too good to continue avoiding (I just have to learn how to use them) and I was missing other progressive aspects of WP by consigning myself to the past.
I have saved last week’s NFTRH 741 as a PDF doc at the NFTRH PDF archive. While it is not formatted as neatly a PDF produced from my usual ‘Pages’ (Apple’s version of Word) document, it can be downloaded as a PDF and should be fine for those who prefer a PDF file to print or reference. I’ll plan to convert and add all online posted reports to the PDF archive going forward.
Also, to create your own PDF from a post, update or report from nftrh.com, click the Print button at left (or below the post on some devices) and select ‘Save to PDF’ and make sure to select the ‘Simplified’ format at the bottom right (not shown on this screenshot, but it’s right below the ‘Margins’ options. By selecting Simplified, images will not be cut off/interrupted by new pages but instead the whole image will be sent to the next page if it does not fit on the previous page.

I am a non-technical individual where web/technology is concerned, so I’ll probably grind some gears writing this week’s report, with each successive post helping me get into the groove of the new editor. So this report may be a bit shorter than normal if I sink time into getting comfortable and learning.
State of the Q4-Q1 Market Rally
Once again using the broad SPX (daily chart) as a guide primarily for the state of the US market, but also generally for the global rally (if SPX were to fail, it would not bode well for most stock markets) we find our downtrending laggard having held the support level we noted last week at 3900 and rising to take out the converging moving averages. This after filling the downside gap as expected.
The bottom line is that the Q4-Q1 rally theme lives on. It has been unspectacular to say the least, but considering other indexes and sectors that have led the way it is a grinding rally with (in my opinion) the main drivers being Fed relief as the economy and inflation signals cool and the story going around that the stock market has already discounted a recession.
As to the implication of this chart, well, it could all end on Monday or it could drag on. SPX has not filled the open upside gap, after all, and that has been an objective since we began managing the prospect of the Q4-Q1 rally in Q4 last year. Oh and last I checked, it’s still Q1. Eh?

Preferred Sectors
While sectors like Energy, Financials, Materials, etc. have been relatively bullish compared to Tech and Growth stocks, I continue to have my eye on the latter to a degree for a possible ‘catch-up’ move. This would depend on the “Fed relief” theme actually being a thing. Fed relief – and the Goldilocks/disinflationary implication that comes with it – would logically benefit that which was more heavily impaired by the previous Fed hawk regime and its inflation fighting implications.
In other words, as inflation expectations rose so too did bond yields, which impaired growth stocks policy situation. In other words, at its core it was projected as ‘a sentiment thing’, not necessarily a fundamental thing.
As to the charts, some interesting catch-up plays with charts that may have formed at least temporary bottoms include…
- Biotech
- Medical Device
- Small Caps and Mid Caps in general
- Cloud/SaaS
- Semiconductor (my preference is Semi Equipment)
Market Sentiment
Unfortunately, and as is often the case, to be bullish during a maturing rally or bull market means you also have to be bullish in line with sentiment that is unhealthy from a contrarian perspective. I’ve traded myself out of many a rally by overreacting to over bullish sentiment, and today’s sentiment profile – so different than it was back in Q4, 2022 – is over bullish.
Dumb money indicators are eating the market. Period. Dumb money is bullish. While gold is fine by Sentimentrader’s view below, we will review Commitments of Traders for gold and silver in the Precious Metals segment that show a rising risk sentiment situation there as well. Separately, why on earth is downtrending crude oil only in the middle range of risk (instead of contrary bullish) while still locked in its downtrend. Well, the factors Sentimentrader uses for these ratings are short-term and skittish, that much I do know.

- Investors Intelligence: Starting to eat the rally, even before the end of week pump.
- AAII: Also was nibbling before the end of week pump.
- NAAIM: now aggressively eating the stock market.
As well, the Citi Economic Surprise index shows that the 2022 situation where the stock market had tanked much further than the CESI is now morphing from that tailwind for bulls into a developing sentiment/fundamental headwind. Even the laggard S&P 500 is running ahead of economic signals, which are quite weak.

Market Sentiment Bottom Line
It’s no longer in the bulls’ favor. To the contrary, sentiment is now shifting in the bears’ favor. But we should keep in mind that sentiment alone is not a good timer. It is a factor, a condition. But a lousy timer.
Global Stock Markets
We have been noting how the weak US dollar has generally benefited global stock markets in relation to the US. We also have been noting Uncle Buck at a longer-term support level, most recently on Jan. 23 in this update including the Gold/Silver ratio.
Last week most global stock markets declined in relation to the S&P 500. That, in my opinion, may be important because if the USD does find support and rally, there could be at least interim problems for global stock markets in relation to US stocks, especially the likes of EM and Asia, which benefited the most.
The positive way to look at it would be that a buying opportunity could be occurring in global stocks as the relative pullbacks are generally still within uptrends. But I am not ready to test such a theory with USD sitting on long-term support (and its 50% Fib retrace). If it is going to rally, and has not even begun to do so that would not seem to be a positive for global stocks (or inflation trades like commodities and insofar as gold is pumped by inflationist gold bugs as ‘anti-USD’, the precious metals either).
Precious Metals
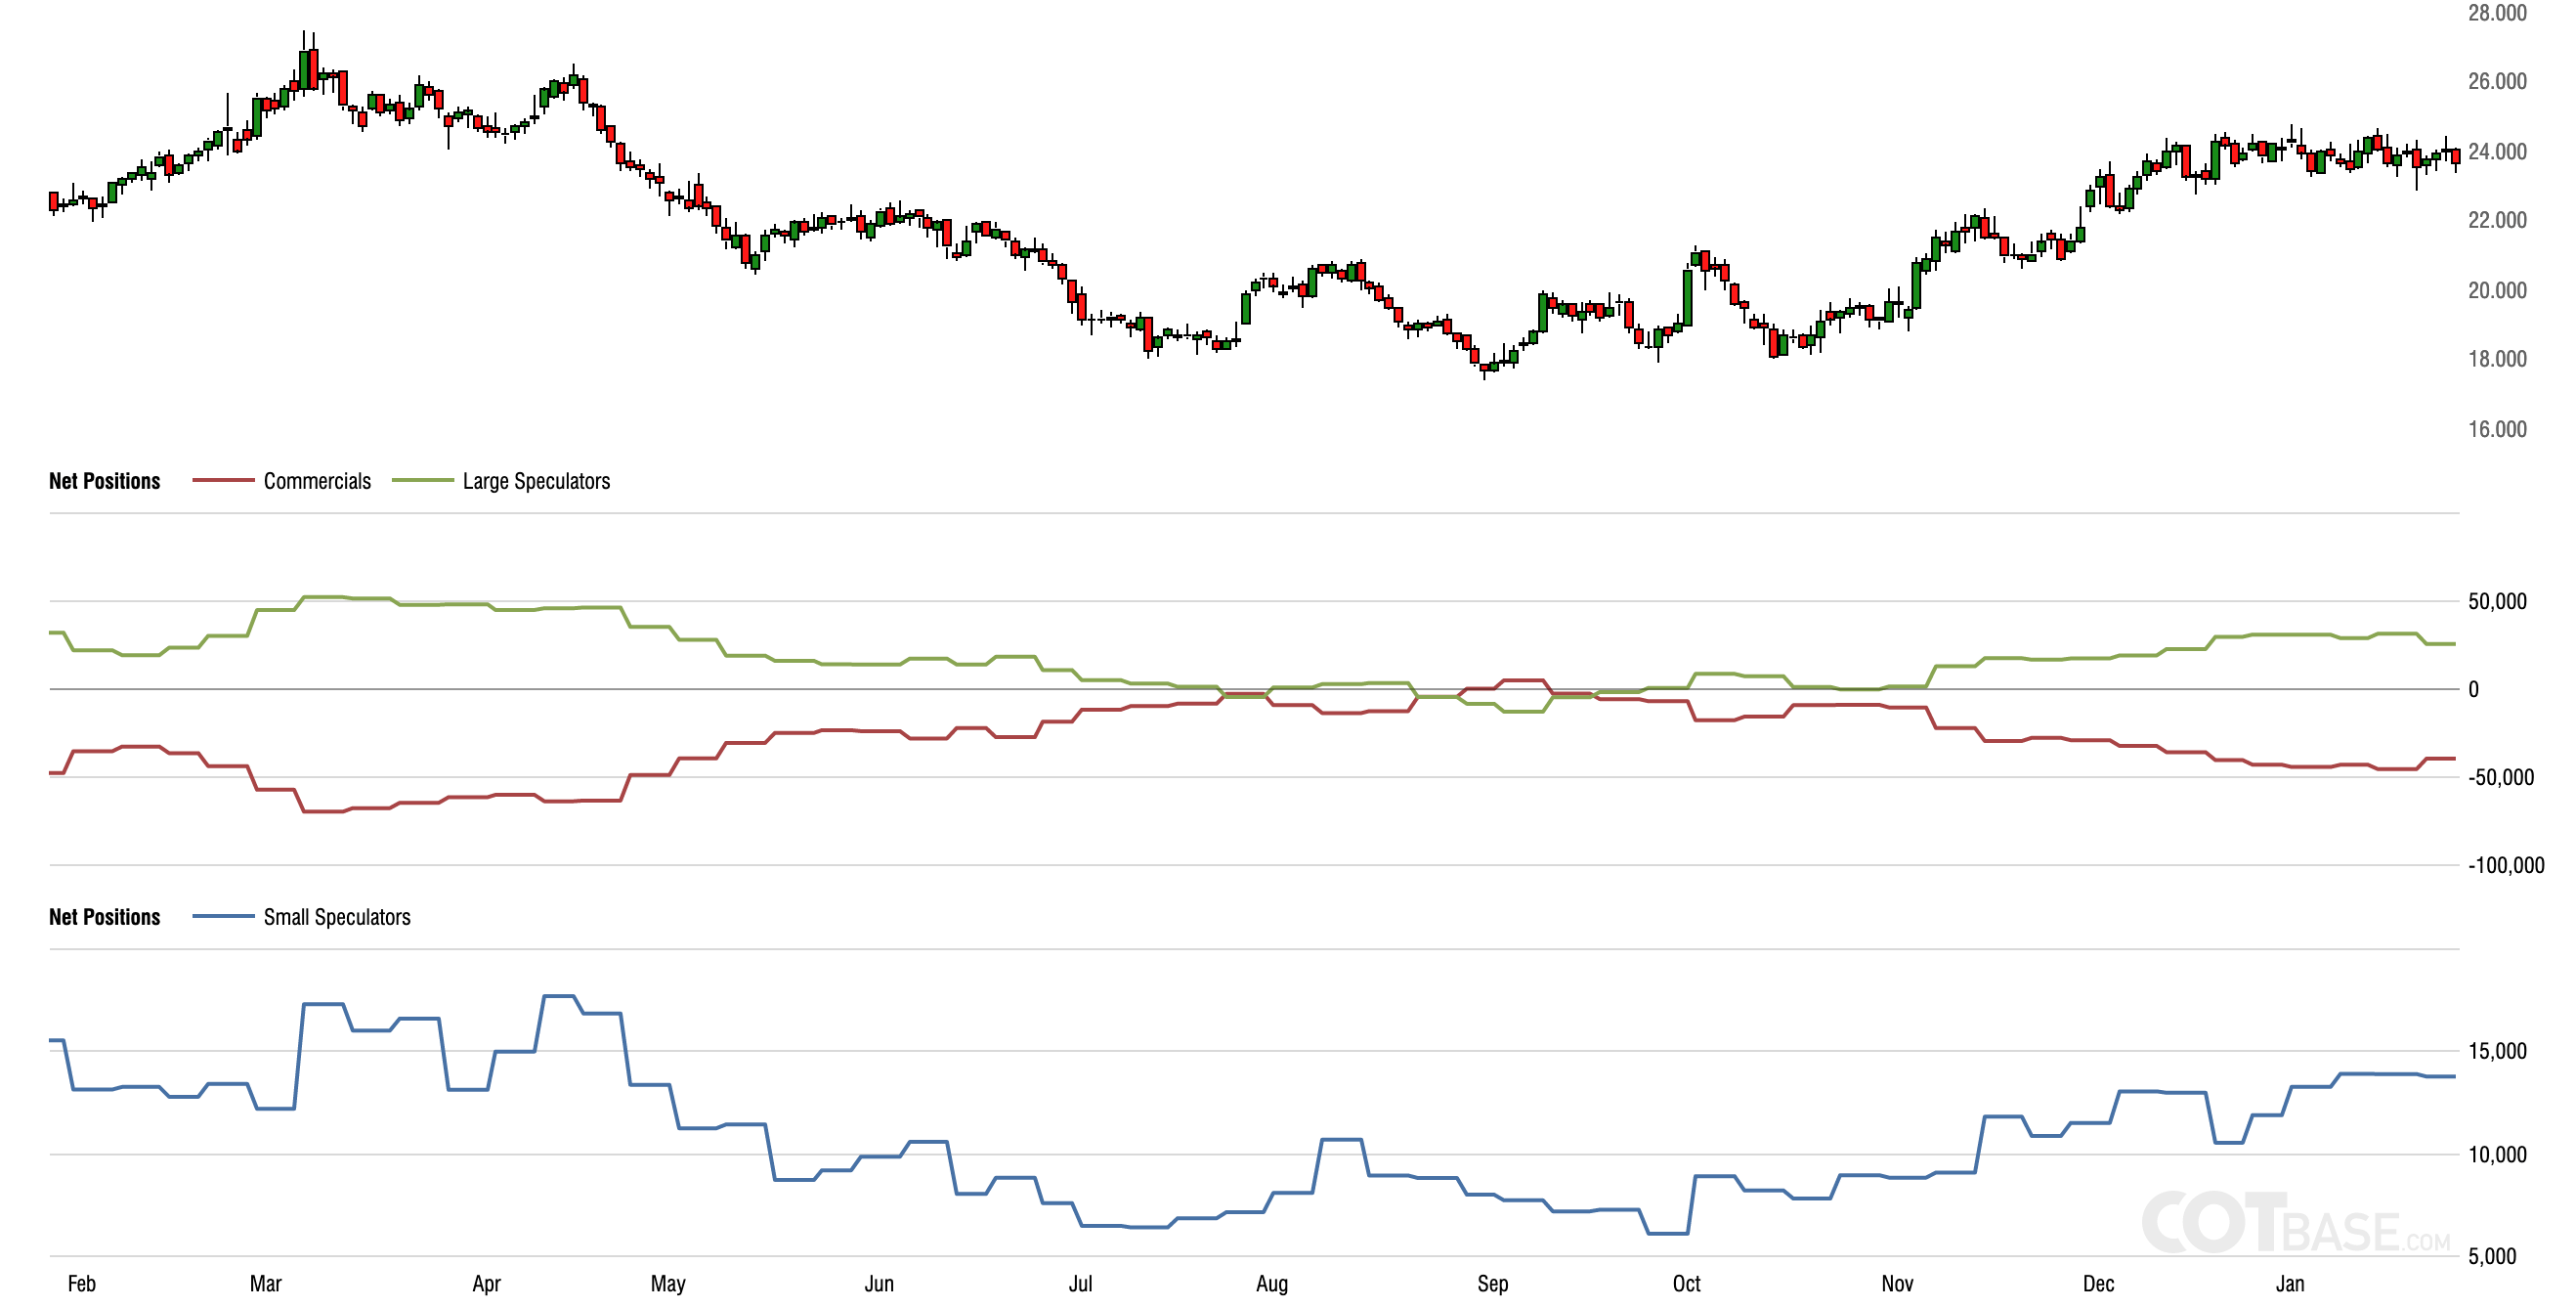
As noted for the US stock market, sentiment is not necessarily a show stopper for the precious metals, but it is also no longer a tailwind. Here (most recent Commitments of Traders) we find large Speculators eating gold, Commercial traders fading it and the little guy dining on some pretty rock as well. For reference, the extremes from last winter are what a “show stopper” looks like. At this point gold could keep rising with sentiment degrading from a contrarian perspective. But the preferred route would be a correction in the metal sooner, rather than later. It could use a pause to refresh.

Silver could guide the way to such a situation as its CoT situation actually moderated a bit last week as logically would happen with price consolidation or pullback. Again, a move in the direction of moderating speculative enthusiasm would likely be healthier for the long-term bullish view, which we are obviously still on for the precious metals. It’s a marathon, not a sprint.
Let’s keep in mind that a majority of gold bugs are anti-USD; rabidly so. That is their vulnerability. They think that inflation = gold bullish! They also think that gold bullish = weak USD. So with USD perched at support what do you think most gold bugs will do if inflation continues to fade and USD rallies? Me too.
While the USD CoT situation is not extreme to the over-bearish side (this chart does not show history long enough to include extremes), where Commercial traders would tick net long, much like gold and silver above, it does show the capacity for an interim move in the opposite direction. In other words, if gold and silver can take an interim pullback based on CoT, USD can take an interim rally even if the major future trends would be up in the precious metals and down in USD.

We have done work lately to gauge the potential for gold stocks to pull back, perhaps after filling one or both of the lower GDX upside gaps. The most recent update was on Wednesday, showing GDX a hair away from the lower gap. The gaps are still unfilled as GDX pulled back on Thursday and Friday.
As you may have seen in the Trade Log, I did some profit taking and may even consider hedging the remaining positions. But you know how it goes with hedging. You have to time it right or else it can be frustrating. So the theme has been that investors can keep in mind that we are on what I believe is a much bigger bull move, but that upside objectives have just about been registered on the near-term.
In other words, gold stocks too fit with the possibilities noted above for gold and silver. That would be for a healthy pullback within a larger bull market move. Here is the monthly chart of HUI, which I like to look at to double check my emotions.

And its companion, the monthly log scale chart.

It is FOMC week and what could be a maturing situation in this leg of the rally, so I am not going to flog the individual stock charts this week. Let’s simply note that if (and of course, a projection is ultimately just an ‘if’, which is why investors might not want to overreact) a pullback comes about we are looking at the January 1st gap below 29 on GDX as a pullback objective.
That would roughly equate to HUI in 230-240 area, which itself equates to the former resistance, now support shown in the first monthly chart above. If I am correct in calling this the 5th leg of a bull market then the 230 area should hold as support. Otherwise, we’d have to reevaluate that. At this point, however, it’s all just projection as the sector has not even begun to correct (aside from silver’s relative weakness, which could be telling).
Gold/Silver stocks currently held: MAI.V (MAIFF), AGI, OGN.V (OGNRF), MAG & SILV
On watch: BTG, GOLD, WDO.TO (WDOFF), ORLA, WPM, SBB.TO (SGSVF), RGLD, FNV, KGC, etc.
Commodities
- CRB Index and its tracker DBC each continue to trend down, but each remained above the 50 day moving average last week in a faint sign of positivity. I’ll continue to have little interest in commodities as a whole while being open to a few specialty plays here and there.
- Crude Oil & NatGas continue to trend down and be bombed out, respectively. No change there. I took the profit on innovative O&G stock NOG, which pumped on Friday on an index inclusion. Still holding AR on spec about NatGas, but not with infinite patience.
- Copper & Industrial Metals (GYX): Copper paused its rally last week GYX got dinged a bit on Friday. They have been trending up since Q4, but I continue to personally have little interest because I don’t buy the China reopening stuff and I do buy a continued easing in global inflationary signaling. But the rally in the copper miners has been a good one. Better even than in gold stocks (and that is part of the short-term problem I have with gold stocks; they are far from unique at this time).
- Palladium & Platinum: Pd is flat out bearish and a negative sign for the global economy. China doesn’t build out with Pd after all, it builds out with Cu and industrial metals. That’s the tout at least. No interest in Pd and if you’re a Platinum bull, Pt has pulled back as far as it should within a buying opportunity scenario. I eyeballed Pt & Pd (and Au, Li, etc.) producer SBSW on its pullback last week before just leaving it alone .
- Uranium: This outlier/specialty segment is sporting charts that could break positively. As such, I hold NXE and am in wait and see mode. Again, I am under no imperative to try to make money in the markets because cash and bonds are paying out just fine lately. But I have U on watch.
- Lithium: Li stocks ALB & LTHM were sold and I’m not looking back. Not yet. The rally has been strong, however, and it is still intact.
- Agricultural (GKX): I released SOYB on the drop through the SMA 50. It was more of an excuse to raise cash than a technical breakdown, as the SMA 200 held the pullback. Still, little current interest but the segment is on casual forward watch.
Commodities Bottom Line
I still don’t care for them in a time of fading inflation signals. Specialties like Lithium and Uranium may go their own way but the inflation trades of 2020-2022 are lame at best. If the US dollar rallies it would keep the pressure on.
Let’s remain aware that the two possible views that have come from the Continuum (30yr Treasury yield long-term monthly chart, ref. last week’s NFTRH 741) are radically different from each other.
- A deflation phase that will be difficult or impossible for policy makers to stop with their hands tied, or…
- A new age of inflation as indicated by the yield’s long-term trend break.
Frankly, I don’t want to get caught guessing wrong. But as long as option 2 is a possibility I’ll keep an eye on vehicles with which to play it, like commodities in general.
Currencies
Let’s switch from the usual daily chart to a weekly chart of USD and the Gold/Silver ratio, where I have imagined a “complex Head & Shoulders” pattern (as TAs who want to sound technical would call a freak pattern pattern with too many shoulders). So I’ve drawn in a couple right side would-be shoulders to match the two on the left.
This imagining would actually fit well with the idea noted above of an interim rally within a bearish larger cycle for USD as these shoulders could represent the making of an A-B-C bear market upward correction. Let’s not stake our lives on it, but it’s a potential over the coming year or so. The Gold/Silver ratio* has risen for a few weeks in a row now and if it is leading Uncle Buck, an A-B-C upward correction seems viable, at least. If applicable, a rise to ‘C’ could further impair anti-USD asset markets prior to any future bull markets.

* As noted over the years, when USD and the GSR ride together it can indicate a US Goldilocks phase at best, and a deflation scare or outright deflation amid liquidity loss at worst.
The daily global currency chart shows everyone still trending up vs. USD since Q4, 2022. The look of CAD and AUD may aid a bump in commodities in the short-term while CHF/USD, a companion to gold, is flattening out a bit. Long story short, the intermediate trends are intact in global currencies.

Portfolios
Savings Account: All interest bearish cash/equivalents, balanced by gold.
Trading Account: All cash/equiv.
Roth IRA (non-taxable, no contributions)
IRA is just under 85% cash/equiv. after some aggressive profit taking last week but also the addition of a few items. The items shaded in green (cash & short-term Treasury bonds) are the ‘no lose’ (cash) and high safety (S/T Treasury) positions as I tried to make clear all through 2022. That is especially the case now that bonds have bottomed for a good rally at least (and bear market end at best) and the Fed has been hawking its way along in tow to out of whack signals like the extreme M2, the the 30yr Continuum’s yield and even its own bloated balance sheet.
But we are not here to simply collect interest. We are here to speculate and heaven forbid, invest as well. But this phase has been a rare opportunity to take the ‘no lose’ options being provided by the Fed, which blew its gasket inflating the system in 2020. So risk management and patience are also in play when it comes to speculating or investing.
I continue to believe that 2023 will provide plenty of speculative opportunity, on both sides of the market and eventually again from the bullish side for the gold stock sector if/as the deflationary (or possibly, economically destructive stagflationary) view comes forth.
Separately, and speaking of speculation, I took a significant profit on half of the VXTRF position last week and may (or may not) look to buy those shares back if it provides a buy opportunity on continued pullback. Also, I lucked into a big up move on CDTX on positive recommendation for FDA approval (importantly, this is a recommendation, not an approval but regardless, hat tip to subscriber RK for this one). Recall that last week the stock was down 7% in the afternoon after I bought it. Ah, speculation. It can be volatile.

You can review the NFTRH privacy policy, terms & conditions under the About menu at nftrh.com.
Gary, I don’t understand the monthly vs log monthly chart. The difference?
Hi Dyrl, Linear charts show equal distance on the Y axis, whereas log scale charts show percent change on the Y axis. My mind tends to work better with the ‘absolute’ view, which is why I use mostly linear charts.
. . .from above;
“By selecting Simplified, images will not be cut off/interrupted by new pages but instead the whole image will be sent to the next page if it does not fit on the previous page. ”
EXCELLENT !!! . . . . Thanks Gary. That’s what I want. Much appreciated