On July 8th we introduced an alternative (to the bearish S/T view) option for gold that involved a potential inverted Head & Shoulders pattern. Let’s update.
First, a daily chart shows the metal having broken out of its downtrend channel for a second time after first breaking out and then failing. Gold is at a key point now below the converged SMA 50 and SMA 200, the latter of which is starting to trend down. Take out that moving average convergence and we might yet get a crack at the orange dashed neckline.
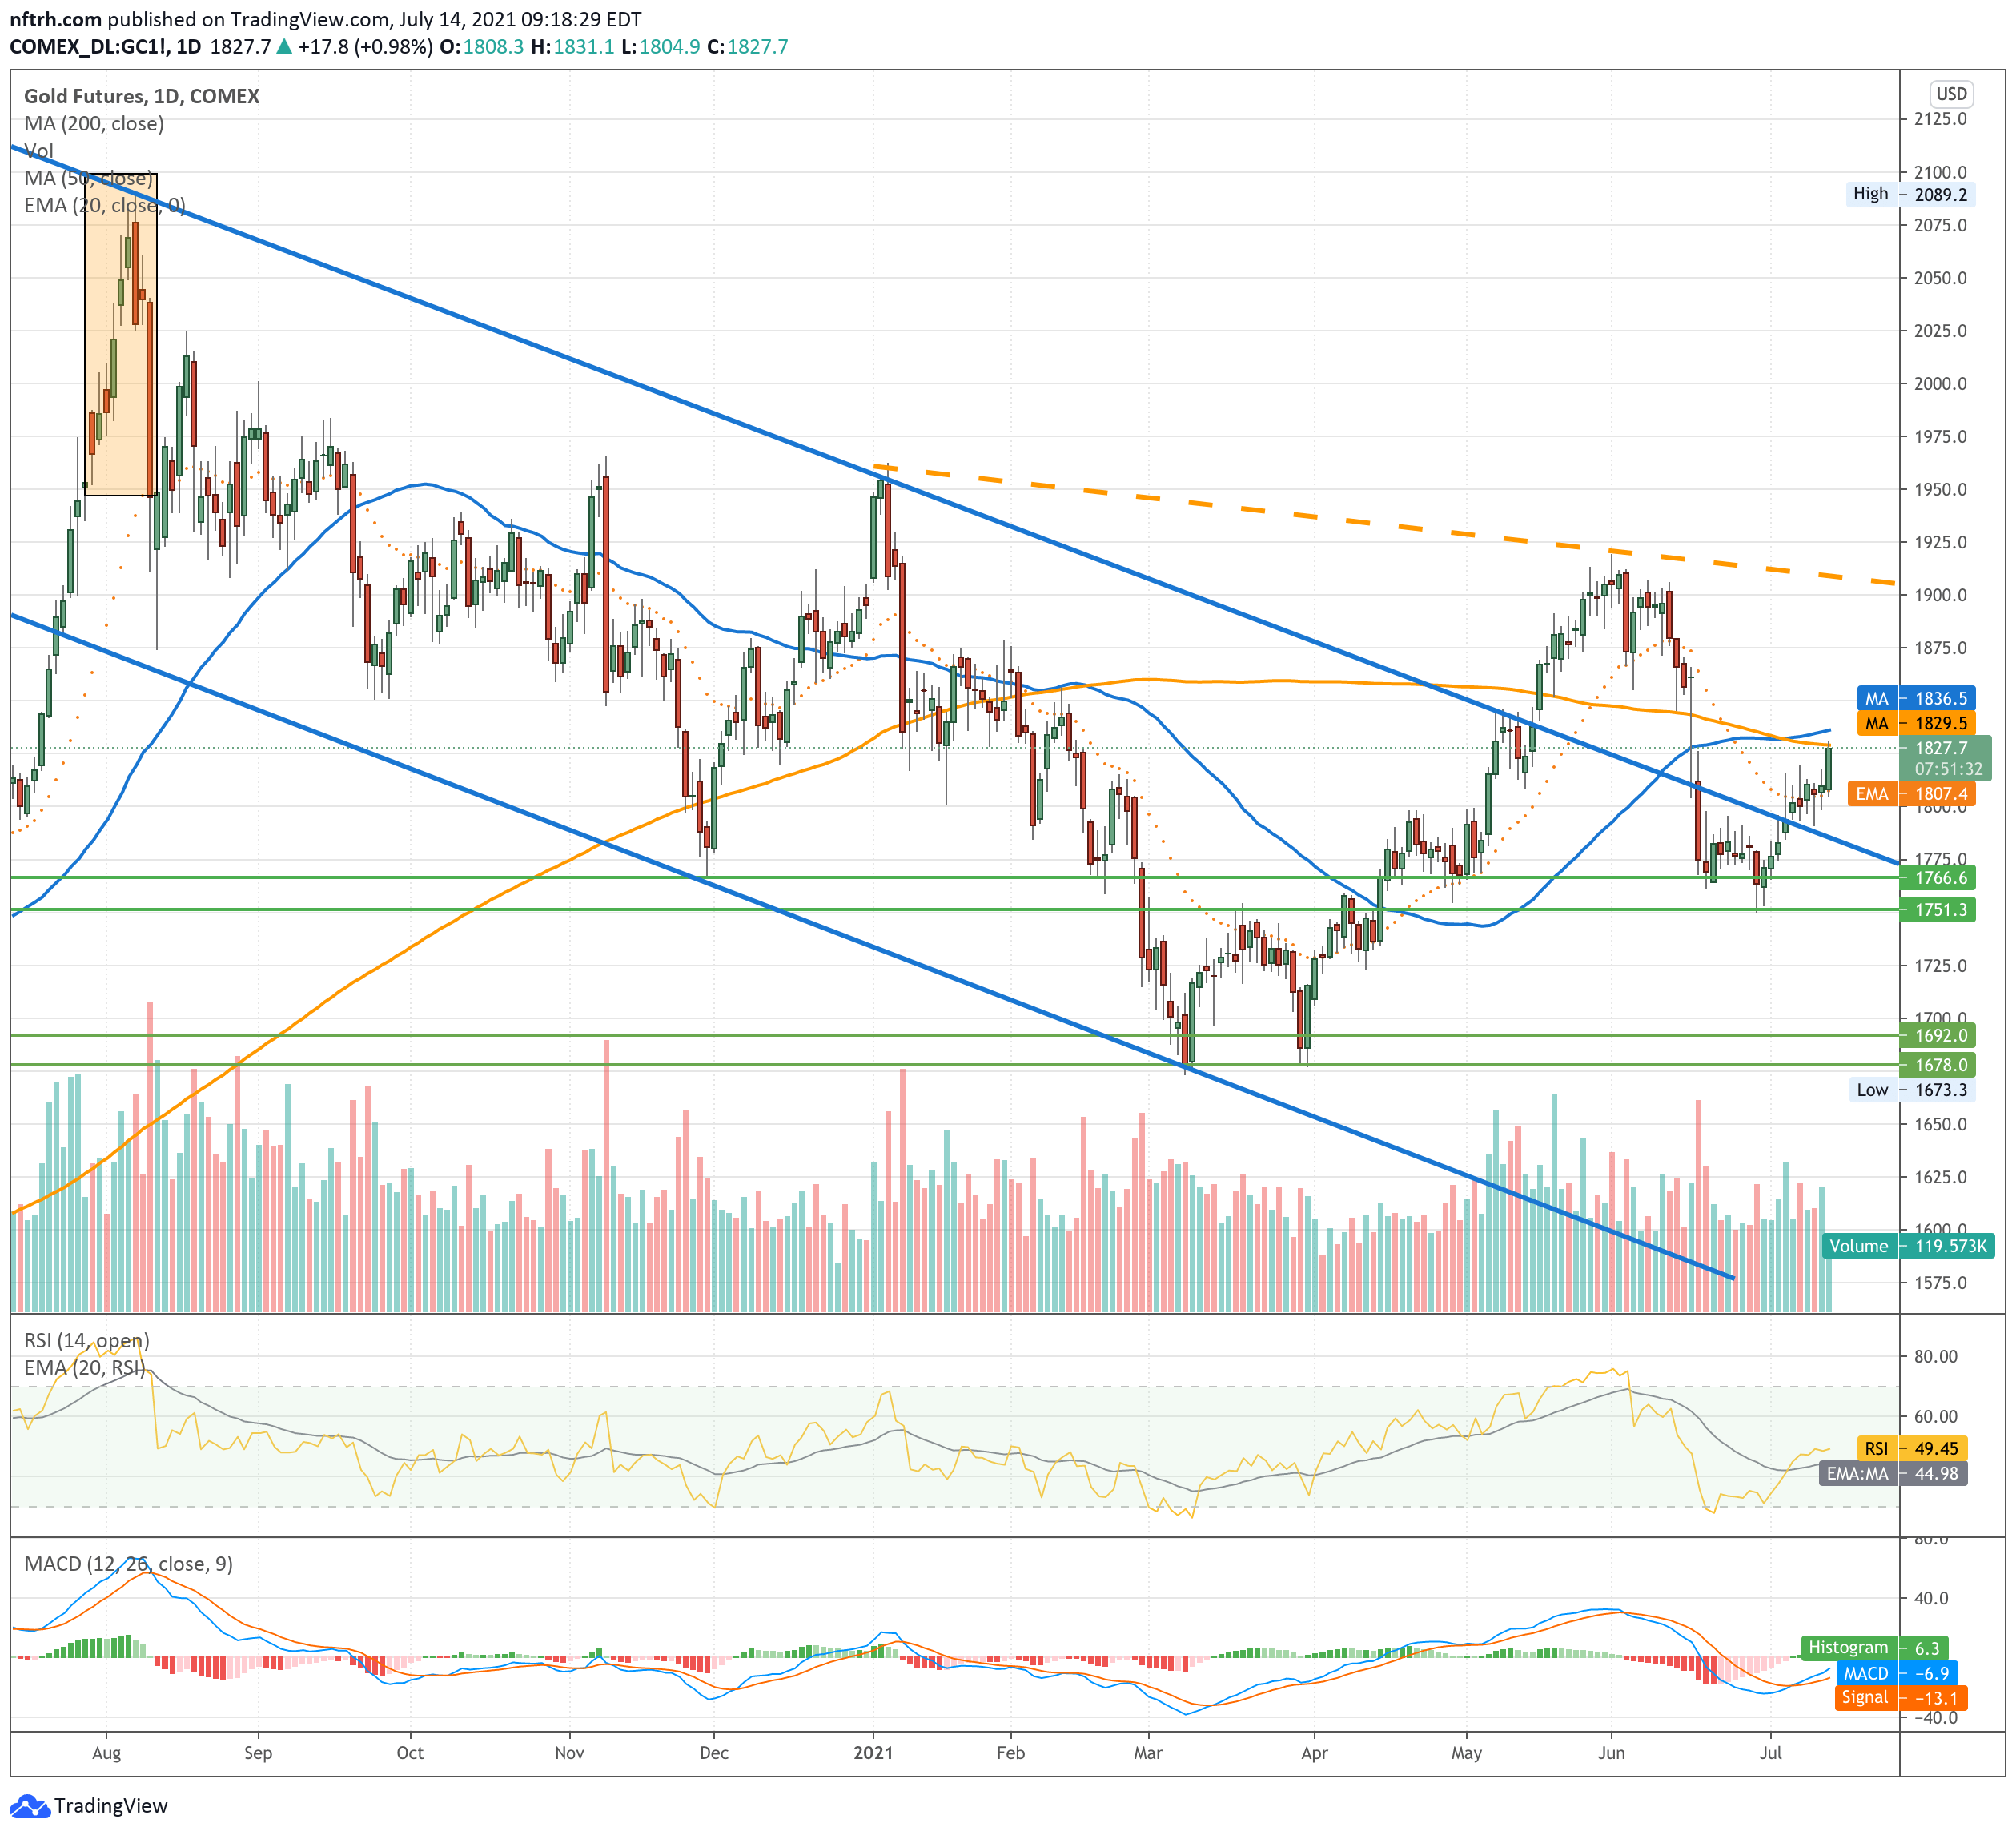
Said neckline is what would activate the theoretical inverted H&S on the weekly chart. Just an FYI to update the progress. Gold has been bearish while stock markets have been very bullish (at least the headline indexes). But we have also noted that the risk vs. reward in gold (as compared to stocks) is very favorable. Price and technicals are the truth of the moment. But Risk/Reward is an opening to future truths.
