Pardon the after hours post, but maybe it’s for the best as I bought this stock at the close (after being out most of the day) and it was stumbled upon because I was researching SaaS and Cloud security and found OKTA to be ridiculously valued, Forgerock to be not yet public, SUMO to be still in its post-IPO smack down. On that stream of though I remembered former holding Pivotal Software, forgot who had bought them, did a search and up came WMware (VMW).
I took a quick look at P/S, P/E and growth metrics and was fairly interested, assuming the chart is okay. I checked the chart, liked what I saw, and so VMW has been added. Here’s the technical view of it.
It’s another of those large software under performers (hello ORCL) in a not unattractive (but sideways) daily chart pattern. So I added the pullback that has been in play over the last week. There’s a good shot it will continue to fade until it tests one or both of the SMA 50 and SMA 200.

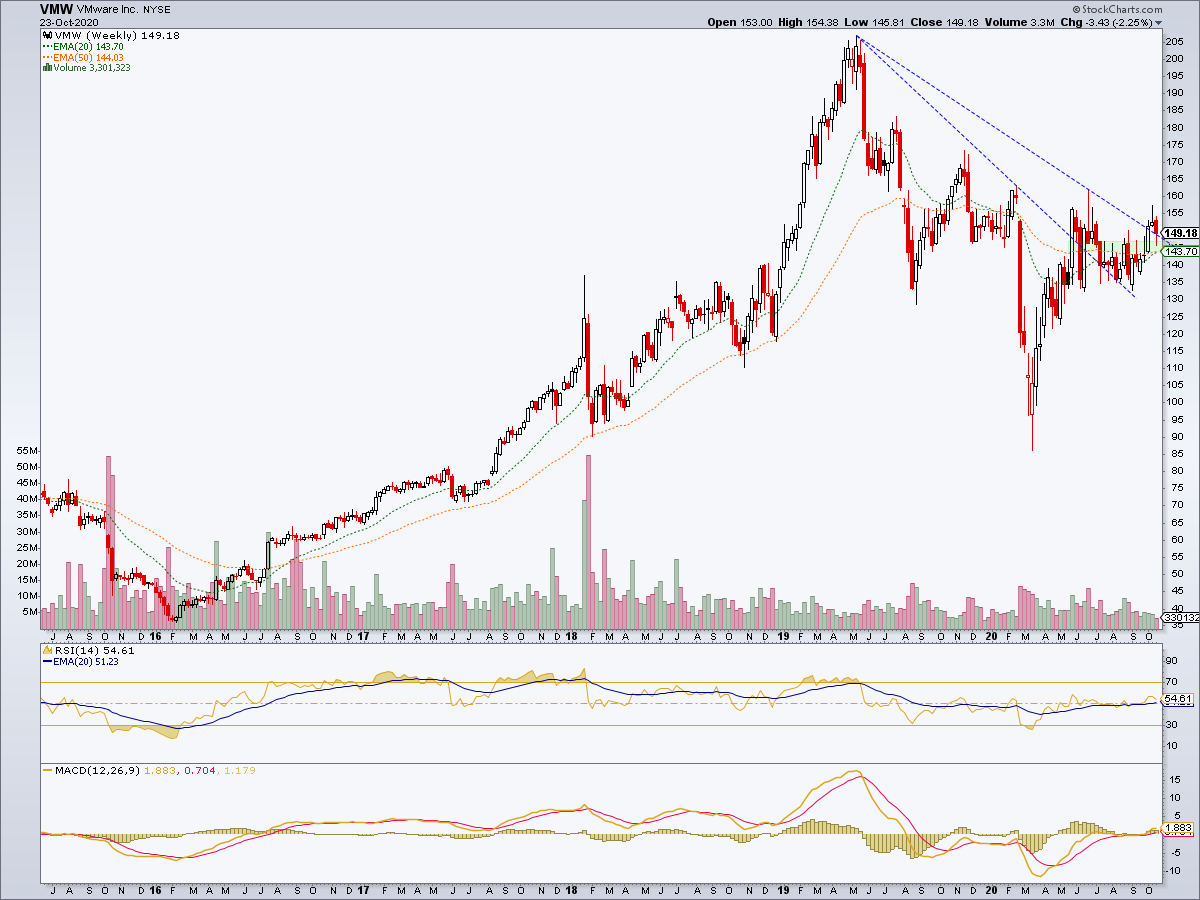
But the weekly chart is why I took the shot. I’d really like to see the convergence of the EMA 20 & EMA 50 hold as support. That would correspond with the SMA 50 on the daily chart above. The measured target is a ridiculous 230. It’s ridiculous if VMW remains a sort of software sector afterthought. But the pattern is interesting, weekly RSI and MACD are positive and there is a place for it in my portfolios as long as it holds support and assuming a stable market backdrop.
A reminder that chart based NFTRH+ updates are technical trade setup ideas, which may not be revisited as the technical parameters are already noted. These updates are meant as a starting point for your further research if interested. I will not personally buy every item highlighted and will sometimes sell (ref. Trade Log) any item that I do buy below target (assuming I’ve not stopped out or sold for some other reason) as I often do. Also please be aware that I am not a fundamental stock analyst. Due diligence is your responsibility.