Let’s look at the gold stock sector from a few different angles.
First, its leadership to SPX, which is fully intact (daily chart).

It’s leadership to gold, which is getting hit hard but is intact. We’d want to see GDX/Gold hold the area of the up sloping daily SMA 50.

While we’re at it, it doesn’t hurt to view Gold/SPX once again, since this is a very important macro indicator for gold stocks. The consolidation has been broken and it appears Au/SPX is reasserting its daily up trends. This is a psychological component of the gold stock case. It may not help in the short-term but it will eventually become a major factor, assuming this is the next leg as it appears to be.

Here is the HUI daily chart we’ve been using to manage short-term pullback/support levels. Today Huey filled the upper gap and does not have clear (if minor) support until around 315. The rising EMA 20 could also support the pullback or it could go deeper to the best support at 300 (to which the SMA 50 is rising).

On the bigger picture (monthly) here is a chart we used last year to project this as only an A-B-C bear market retrace rally. The only thing that’s been changed on the chart is that resistance below 300 has been changed to support (green).
Now, I am no longer labeling it a bear market but as a reminder, we used this chart to project what then would be a major rally to 375 and point ‘C’, even with a conservative assumption that it was still a bear market. Since then, macro and fundamental inputs have come in that put a strong lean on a real bull market (cyclical or better) but either way the chart says ‘caution at 375’ as it is a major resistance zone. Huey came very close to the zone as you can see.
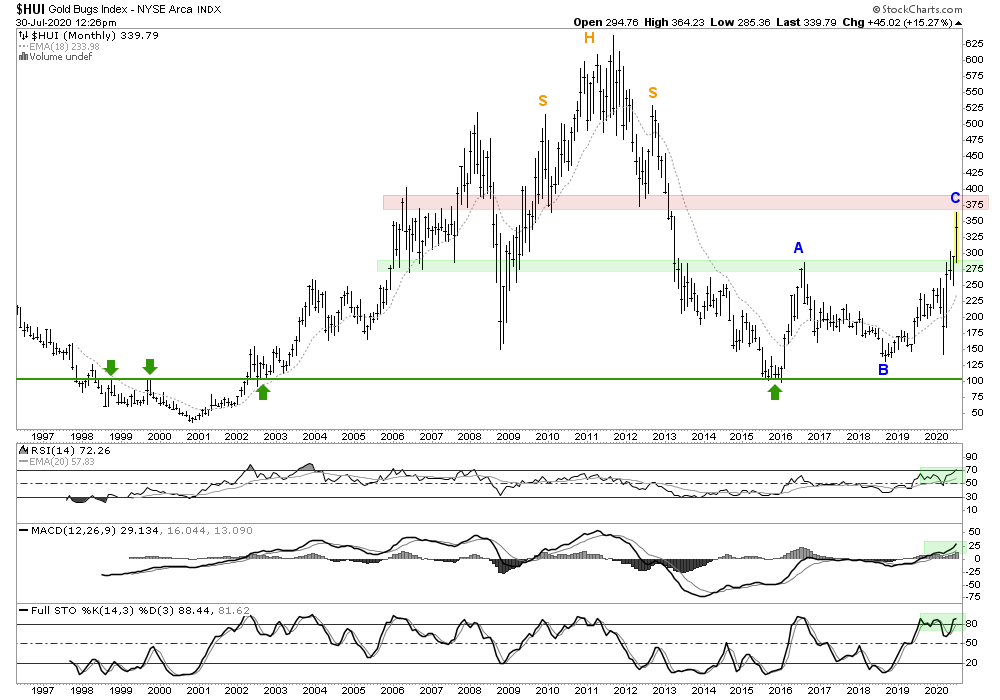
That said, bullish is bullish until some supports start being lost on the daily chart. With the poke above 360 I am going to consider the target zone in the books effectively, if not literally. This may help us be patient with the process. If HUI holds support, great, let’s party a little more. But it’s been a really good run and speaking as a chartist only, risk vs. reward has risen markedly, or so I’d have thought when I originally produced the monthly A-B-C chart.
I found myself wanting to start buying here but doing this update has kept me pretty content with my current positioning for now. Let’s see how Huey handles the pullback on the daily chart. Gap fill? EMA 20? SMA 50?