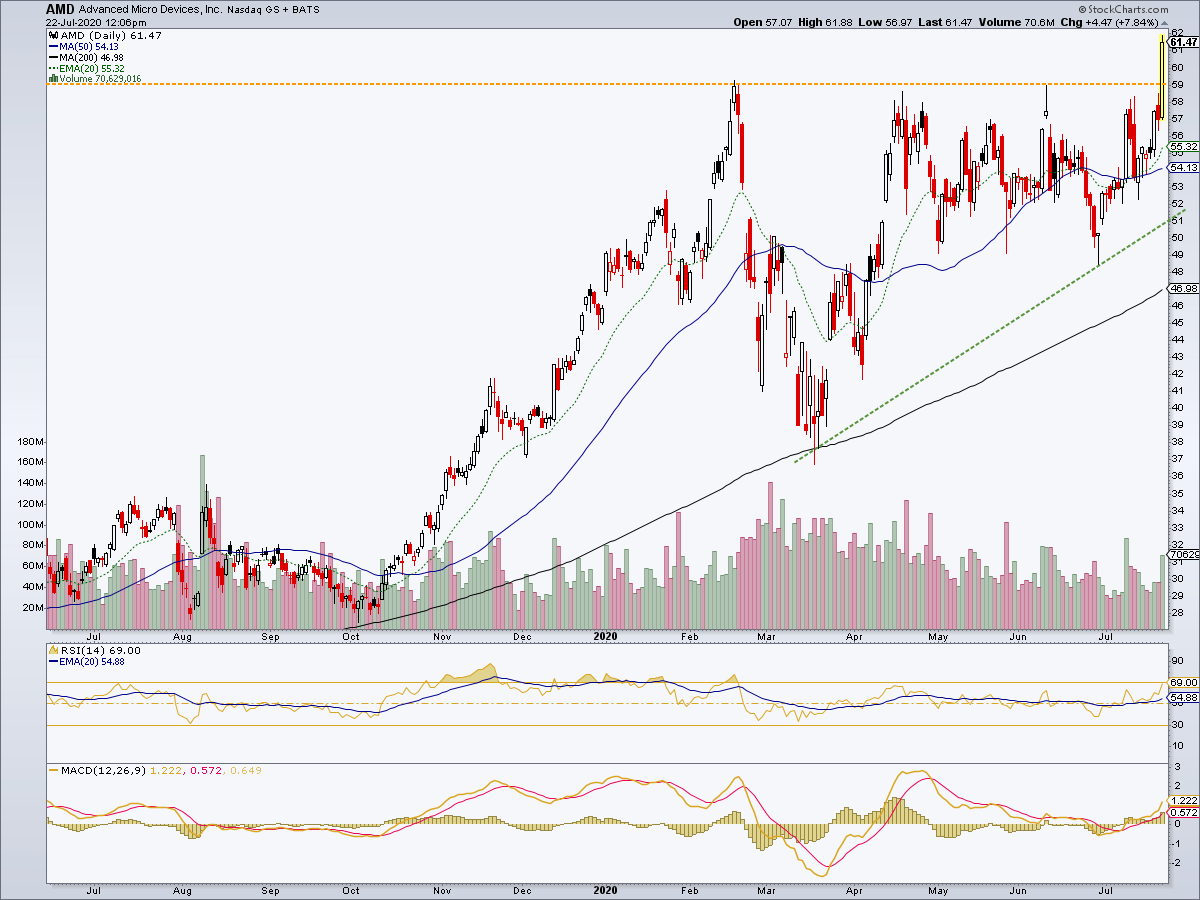
Hey, it’s not all silver and the miners in the markets. For all the talk out there of Tech needing a correction here is chip maker AMD doing the opposite. It is breaking out of a bullish Symmetrical Ascending Triangle (pardon my mistake).
The optimal buy area would be a pullback to 58-59 to test the breakout. But this stock has remained in a major uptrend since before and through the March crash and now it appears to be baring the fruits of that up trending grind. This is as much a market update as an AMD update. Charts like this ask us to keep open minds beyond what we think we know.
As to this daily chart, the implied eventual target is around 68 if the breakout holds. If the breakout does not hold then the SMA 50 becomes a key support marker to the up trending situation.
A reminder that chart based NFTRH+ updates are technical trade setup ideas, which may not be revisited as the technical parameters are already noted. These updates are meant as a starting point for your further research if interested. I will not personally buy every item highlighted and will sometimes sell (ref. Trade Log) any item that I do buy below target (assuming I’ve not stopped out or sold for some other reason) as I often do. Also please be aware that I am not a fundamental stock analyst. Due diligence is your responsibility.