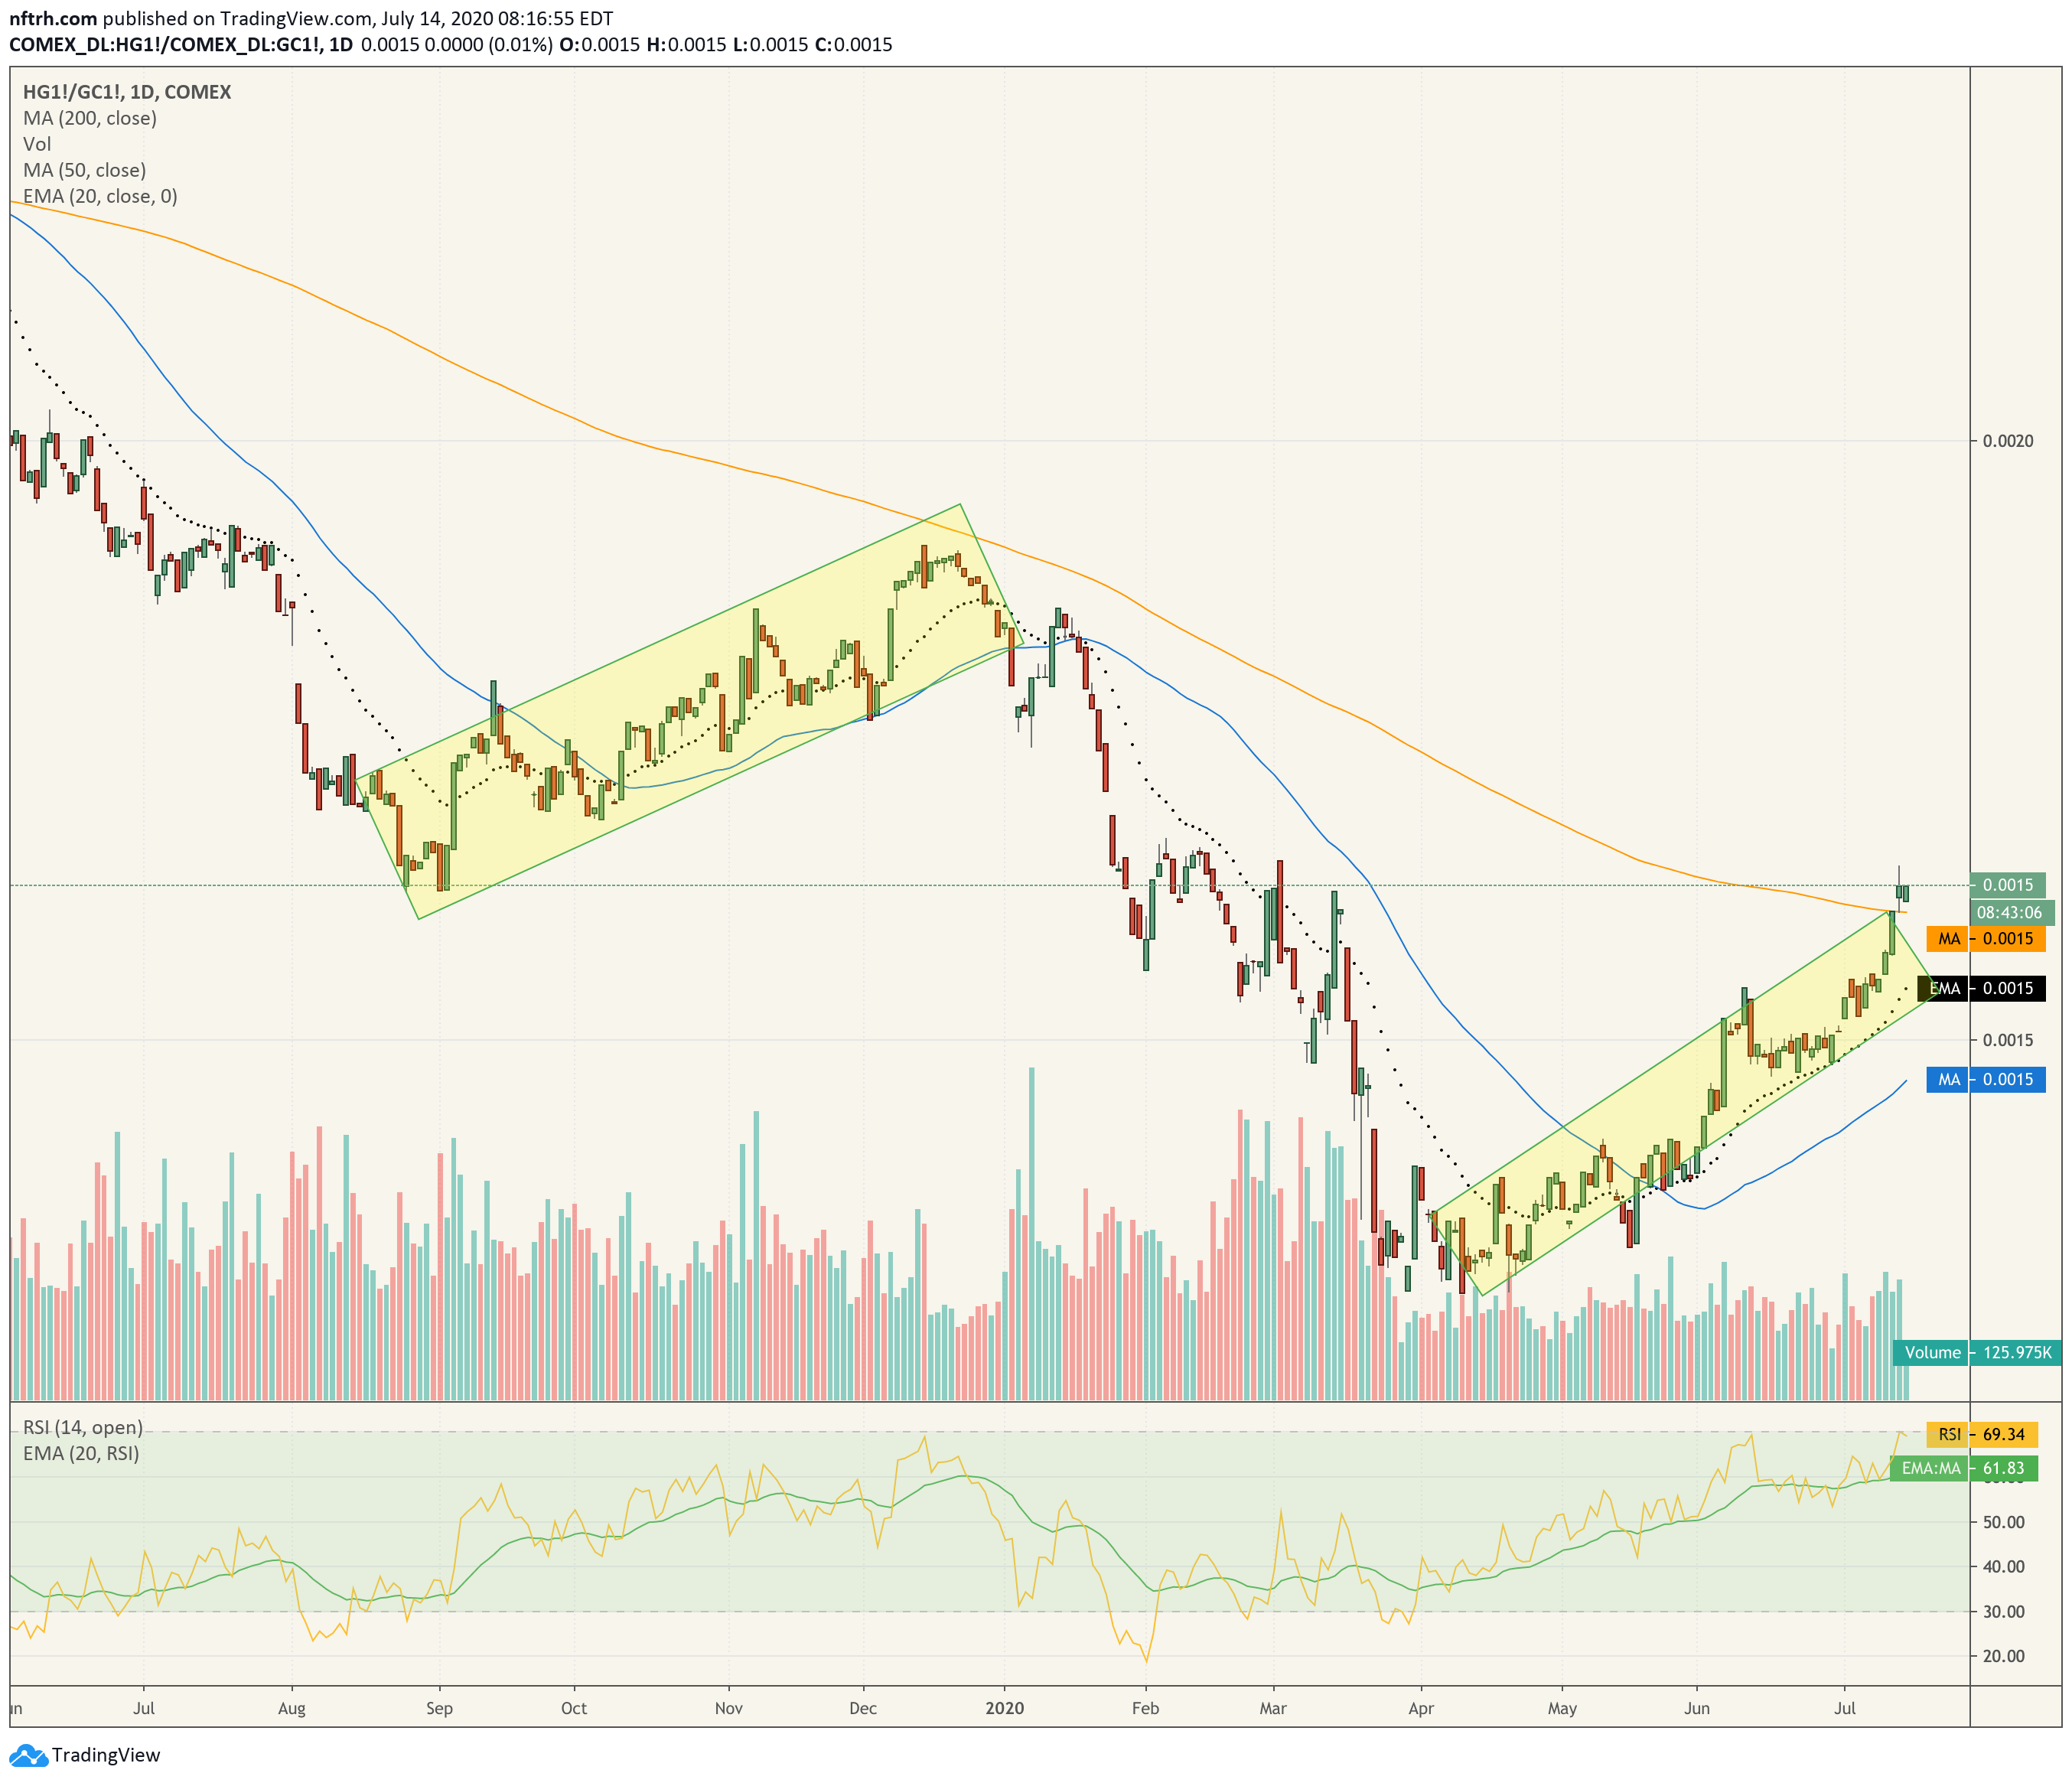
Interesting charts this morning, pre-US open. Let’s start with the metal that has been the star lately. That would be the good Doctor Copper.
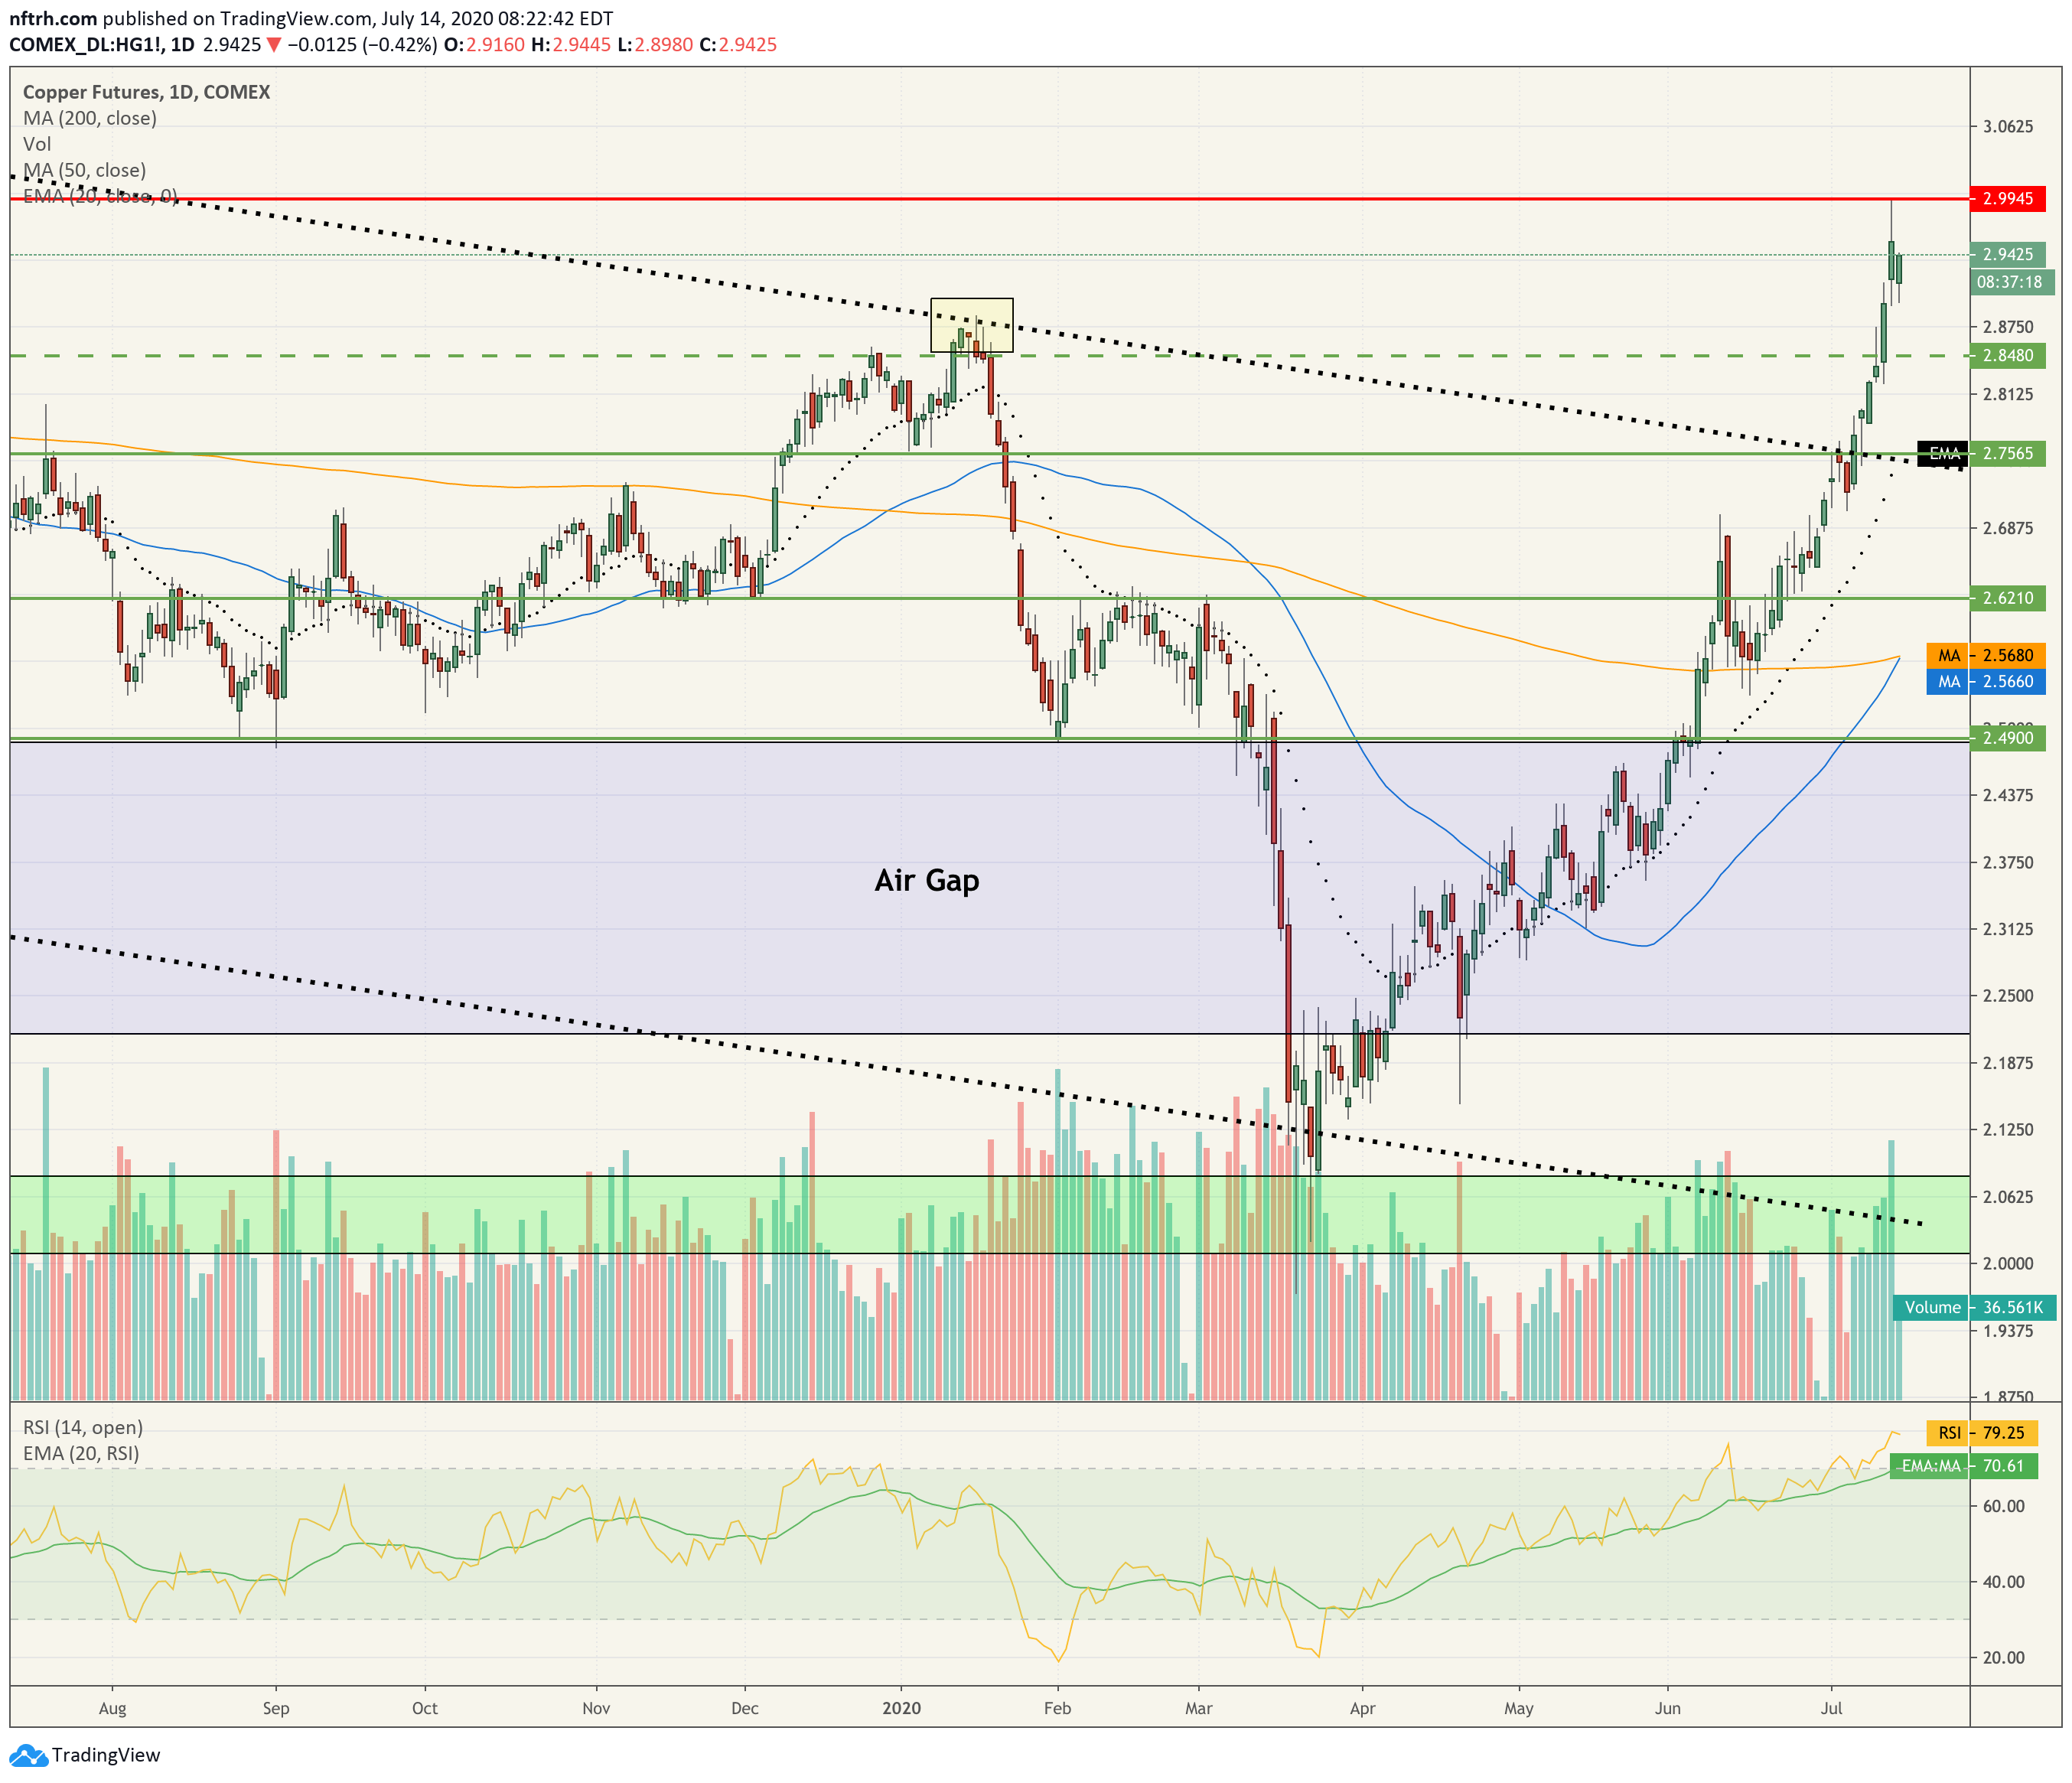
Daily copper took out what I had called a bull pivot at 2.85, with ease. Yesterday it banged against long-term, round number resistance at 3 (see monthly chart below). Volume is piling into the trade and it is bullish until it is not.
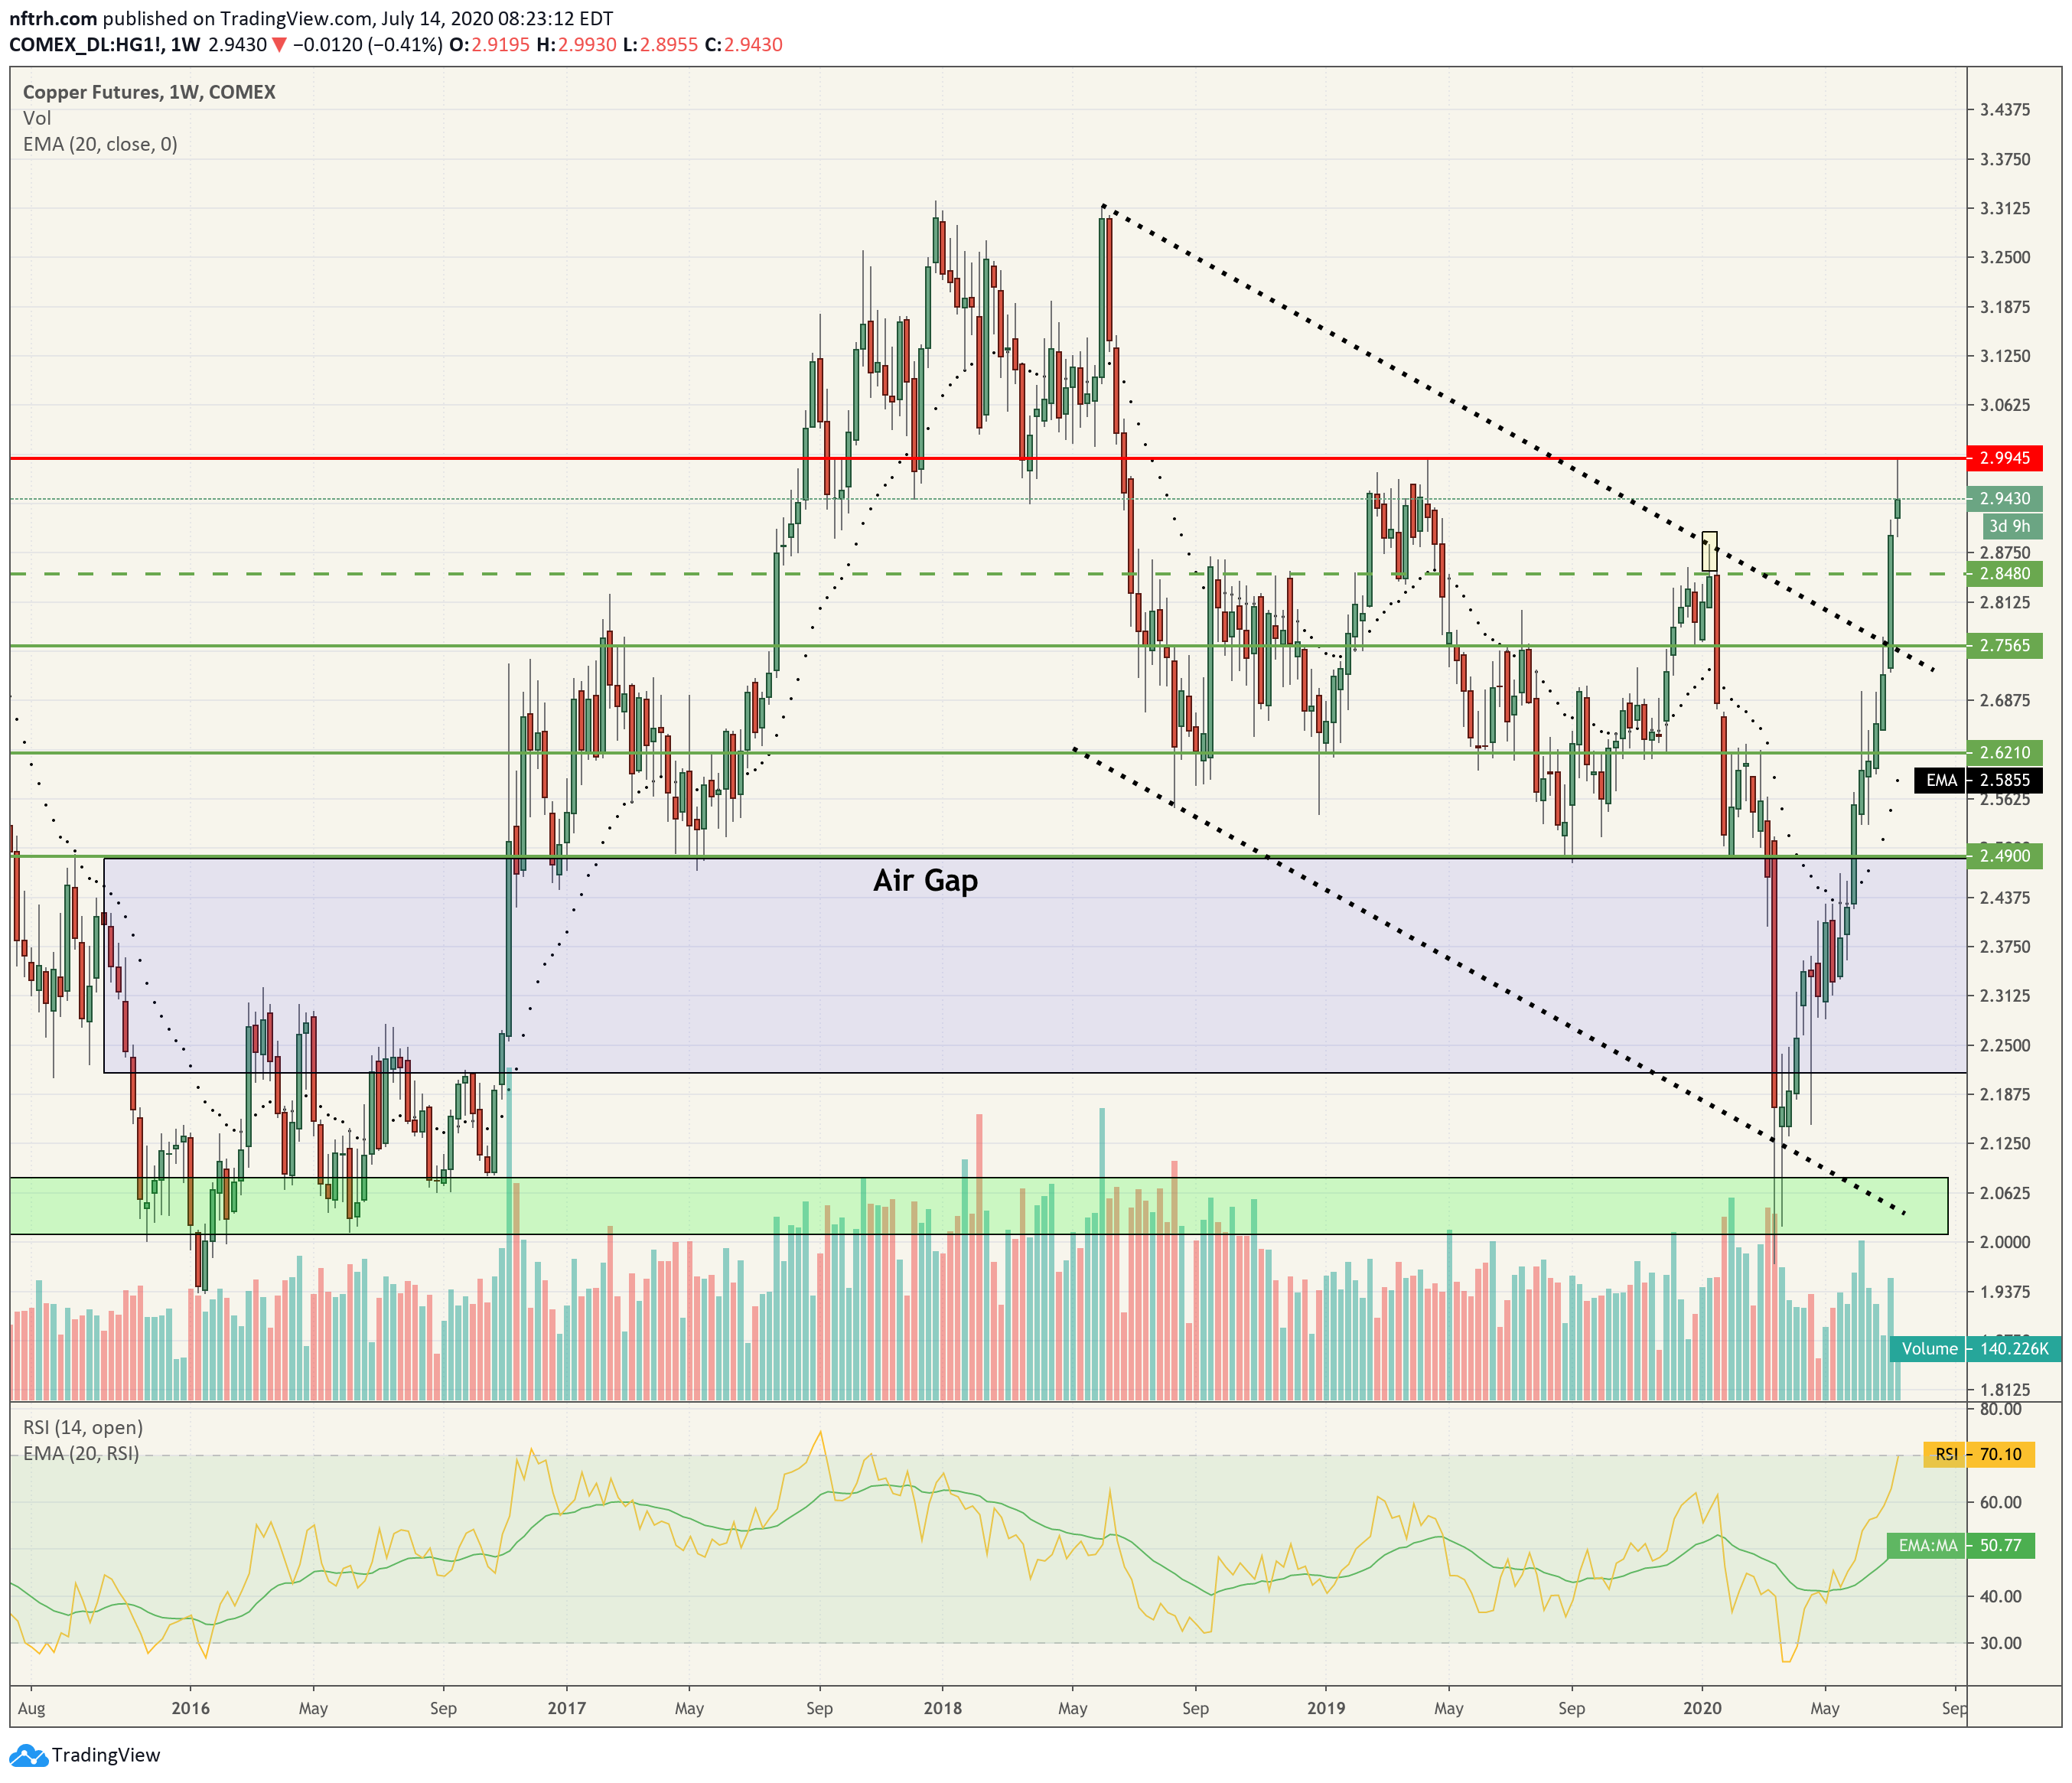
Copper weekly shows clear resistance from which the overbought cyclical metal recoiled after breaking the downtrend channel. Regardless of whether copper takes a bearish turn from here this could be a bull marker for a future inflation trade. It could also be a stand-alone, hope and desperation filled surge to remedy the terrorized angst of the March crash.
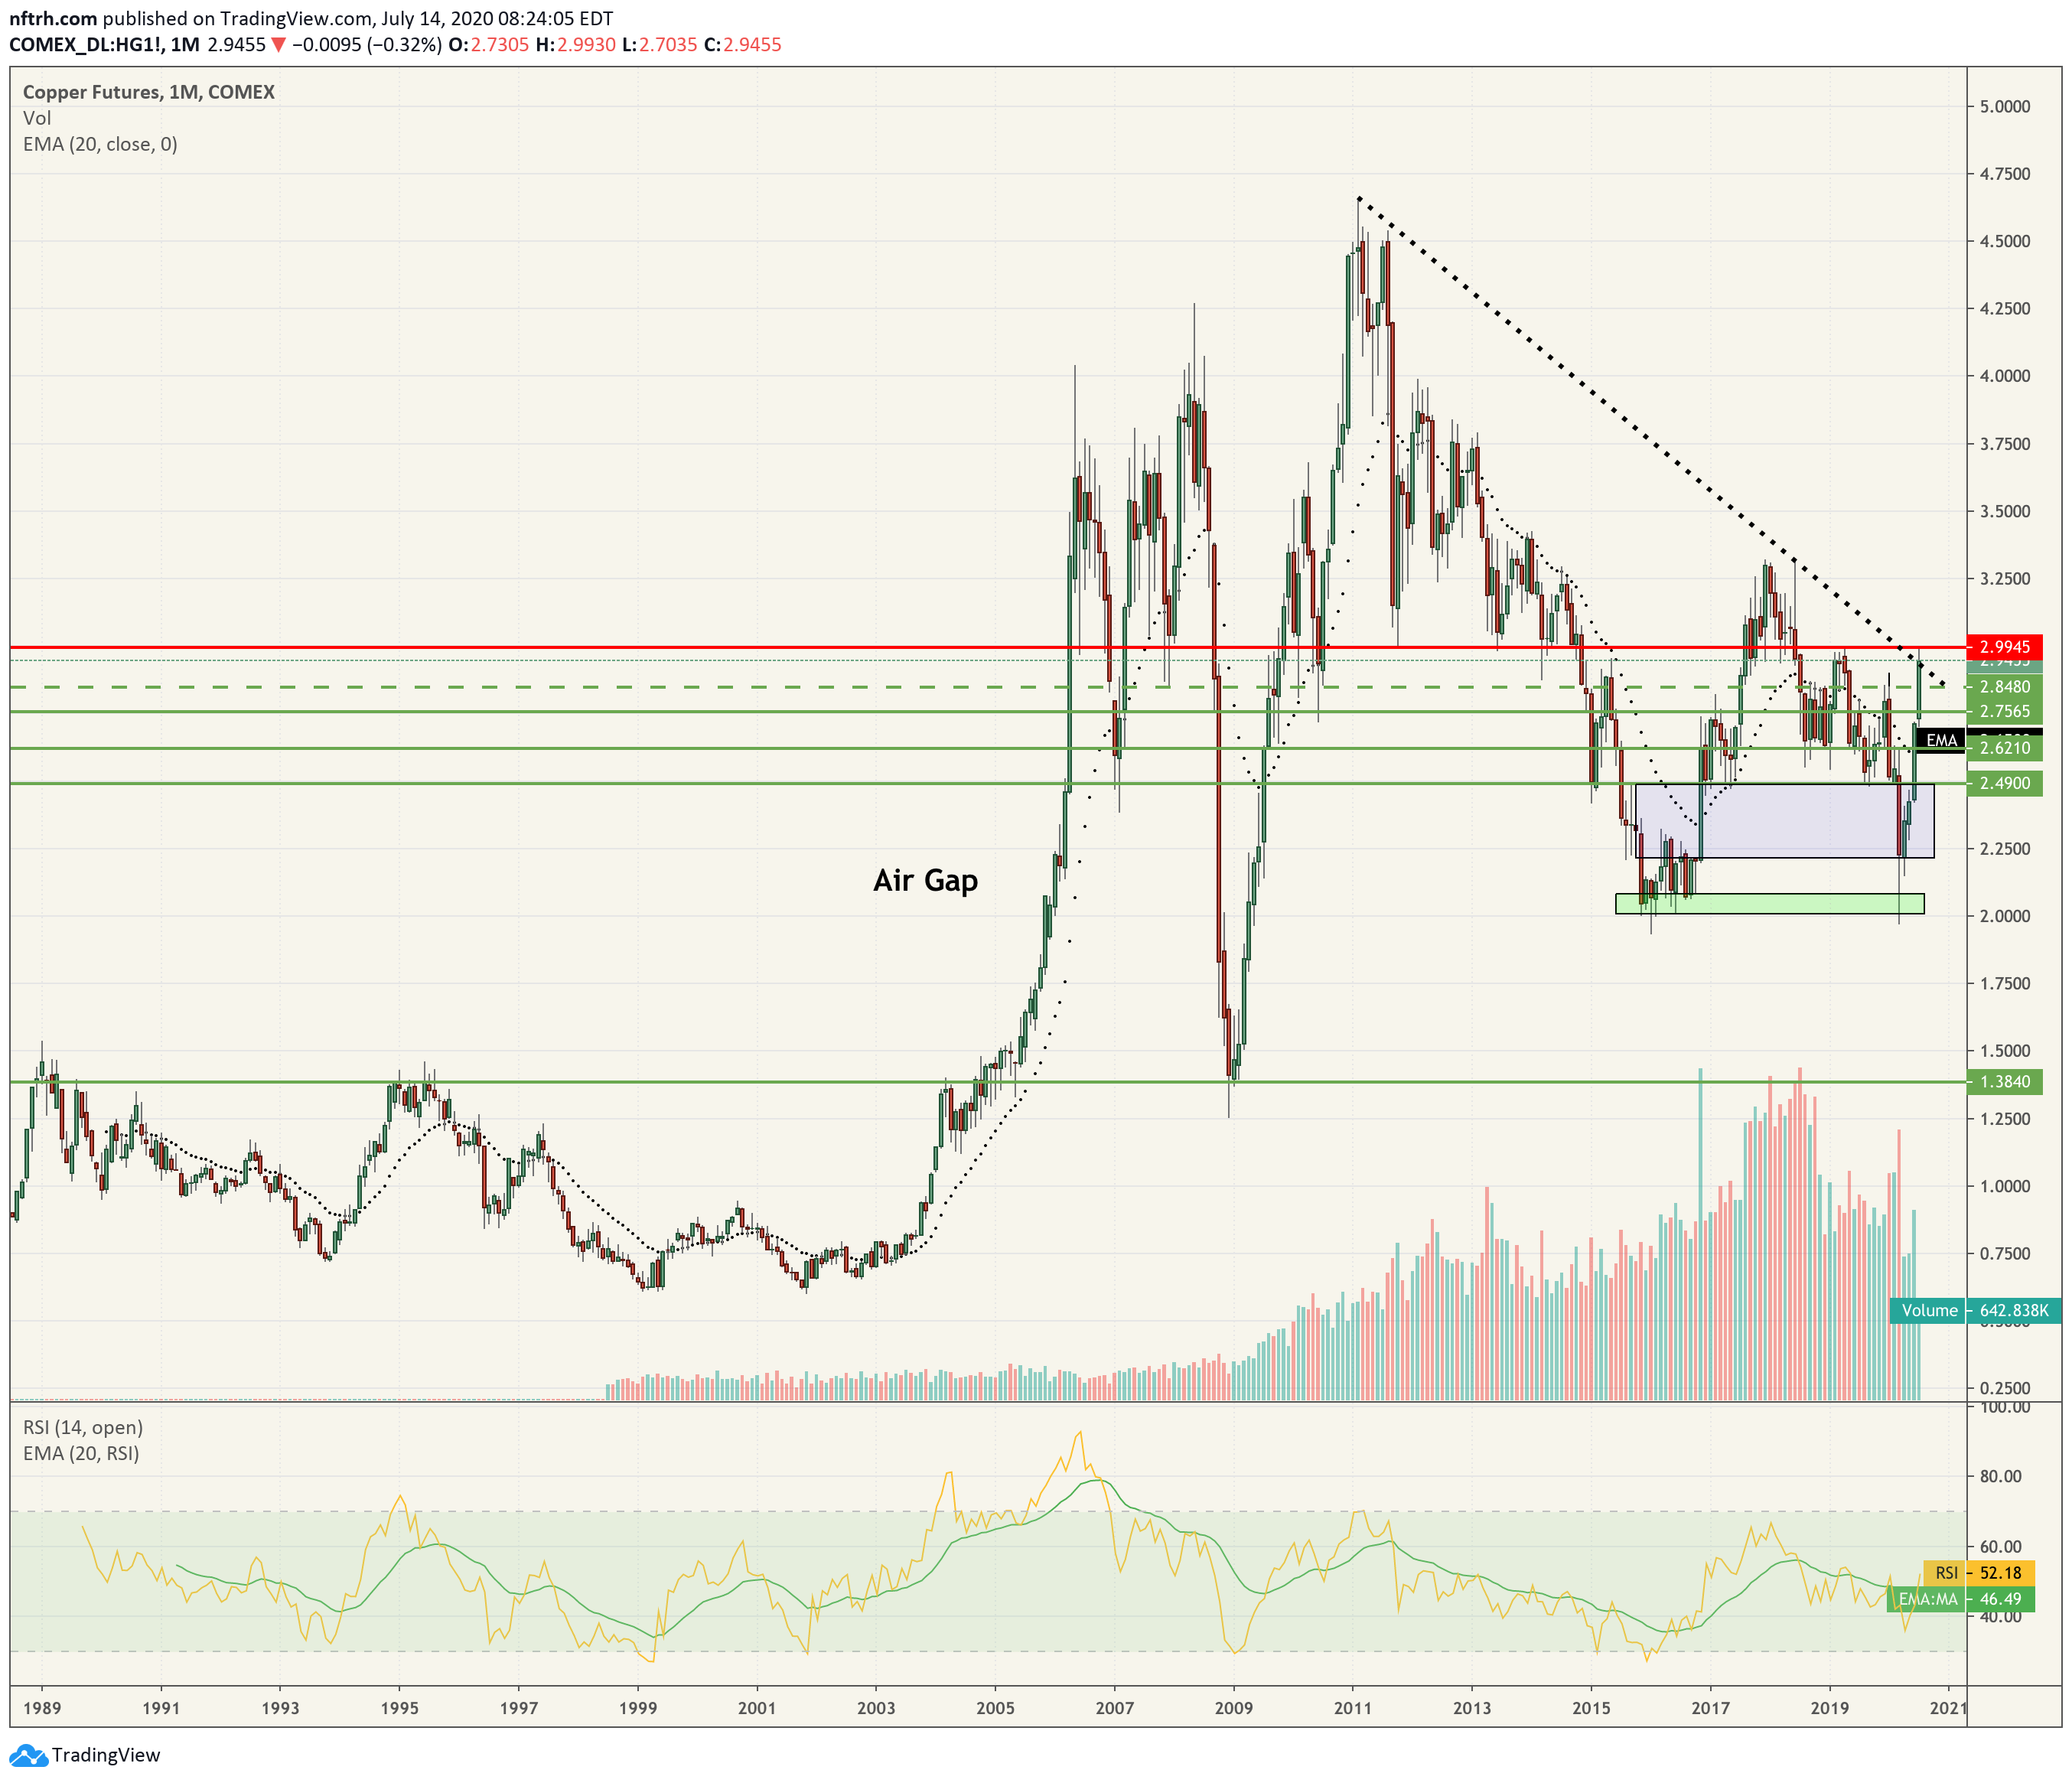
Copper monthly is where the concern comes in, as per NFTRH 611. The combination of the trend line from the 2011 top and the clear resistance at 3 is a very key intersection. Frankly, I should have been making a bigger deal about this level instead of focusing so much on the lower levels lately. There are a lot of historical touch points at 3.
We have noted this area in the past. We have also noted that even a rise to 3.25 would be within an ongoing bear market. A real bull is only indicated if 3.32 is taken out.
Copper’s relative performance to counter-cyclical gold (daily) shows the happy global macro stuff is ongoing, indicator-wise. The ratio popped above the daily SMA 200, a key objective but still a downtrend.
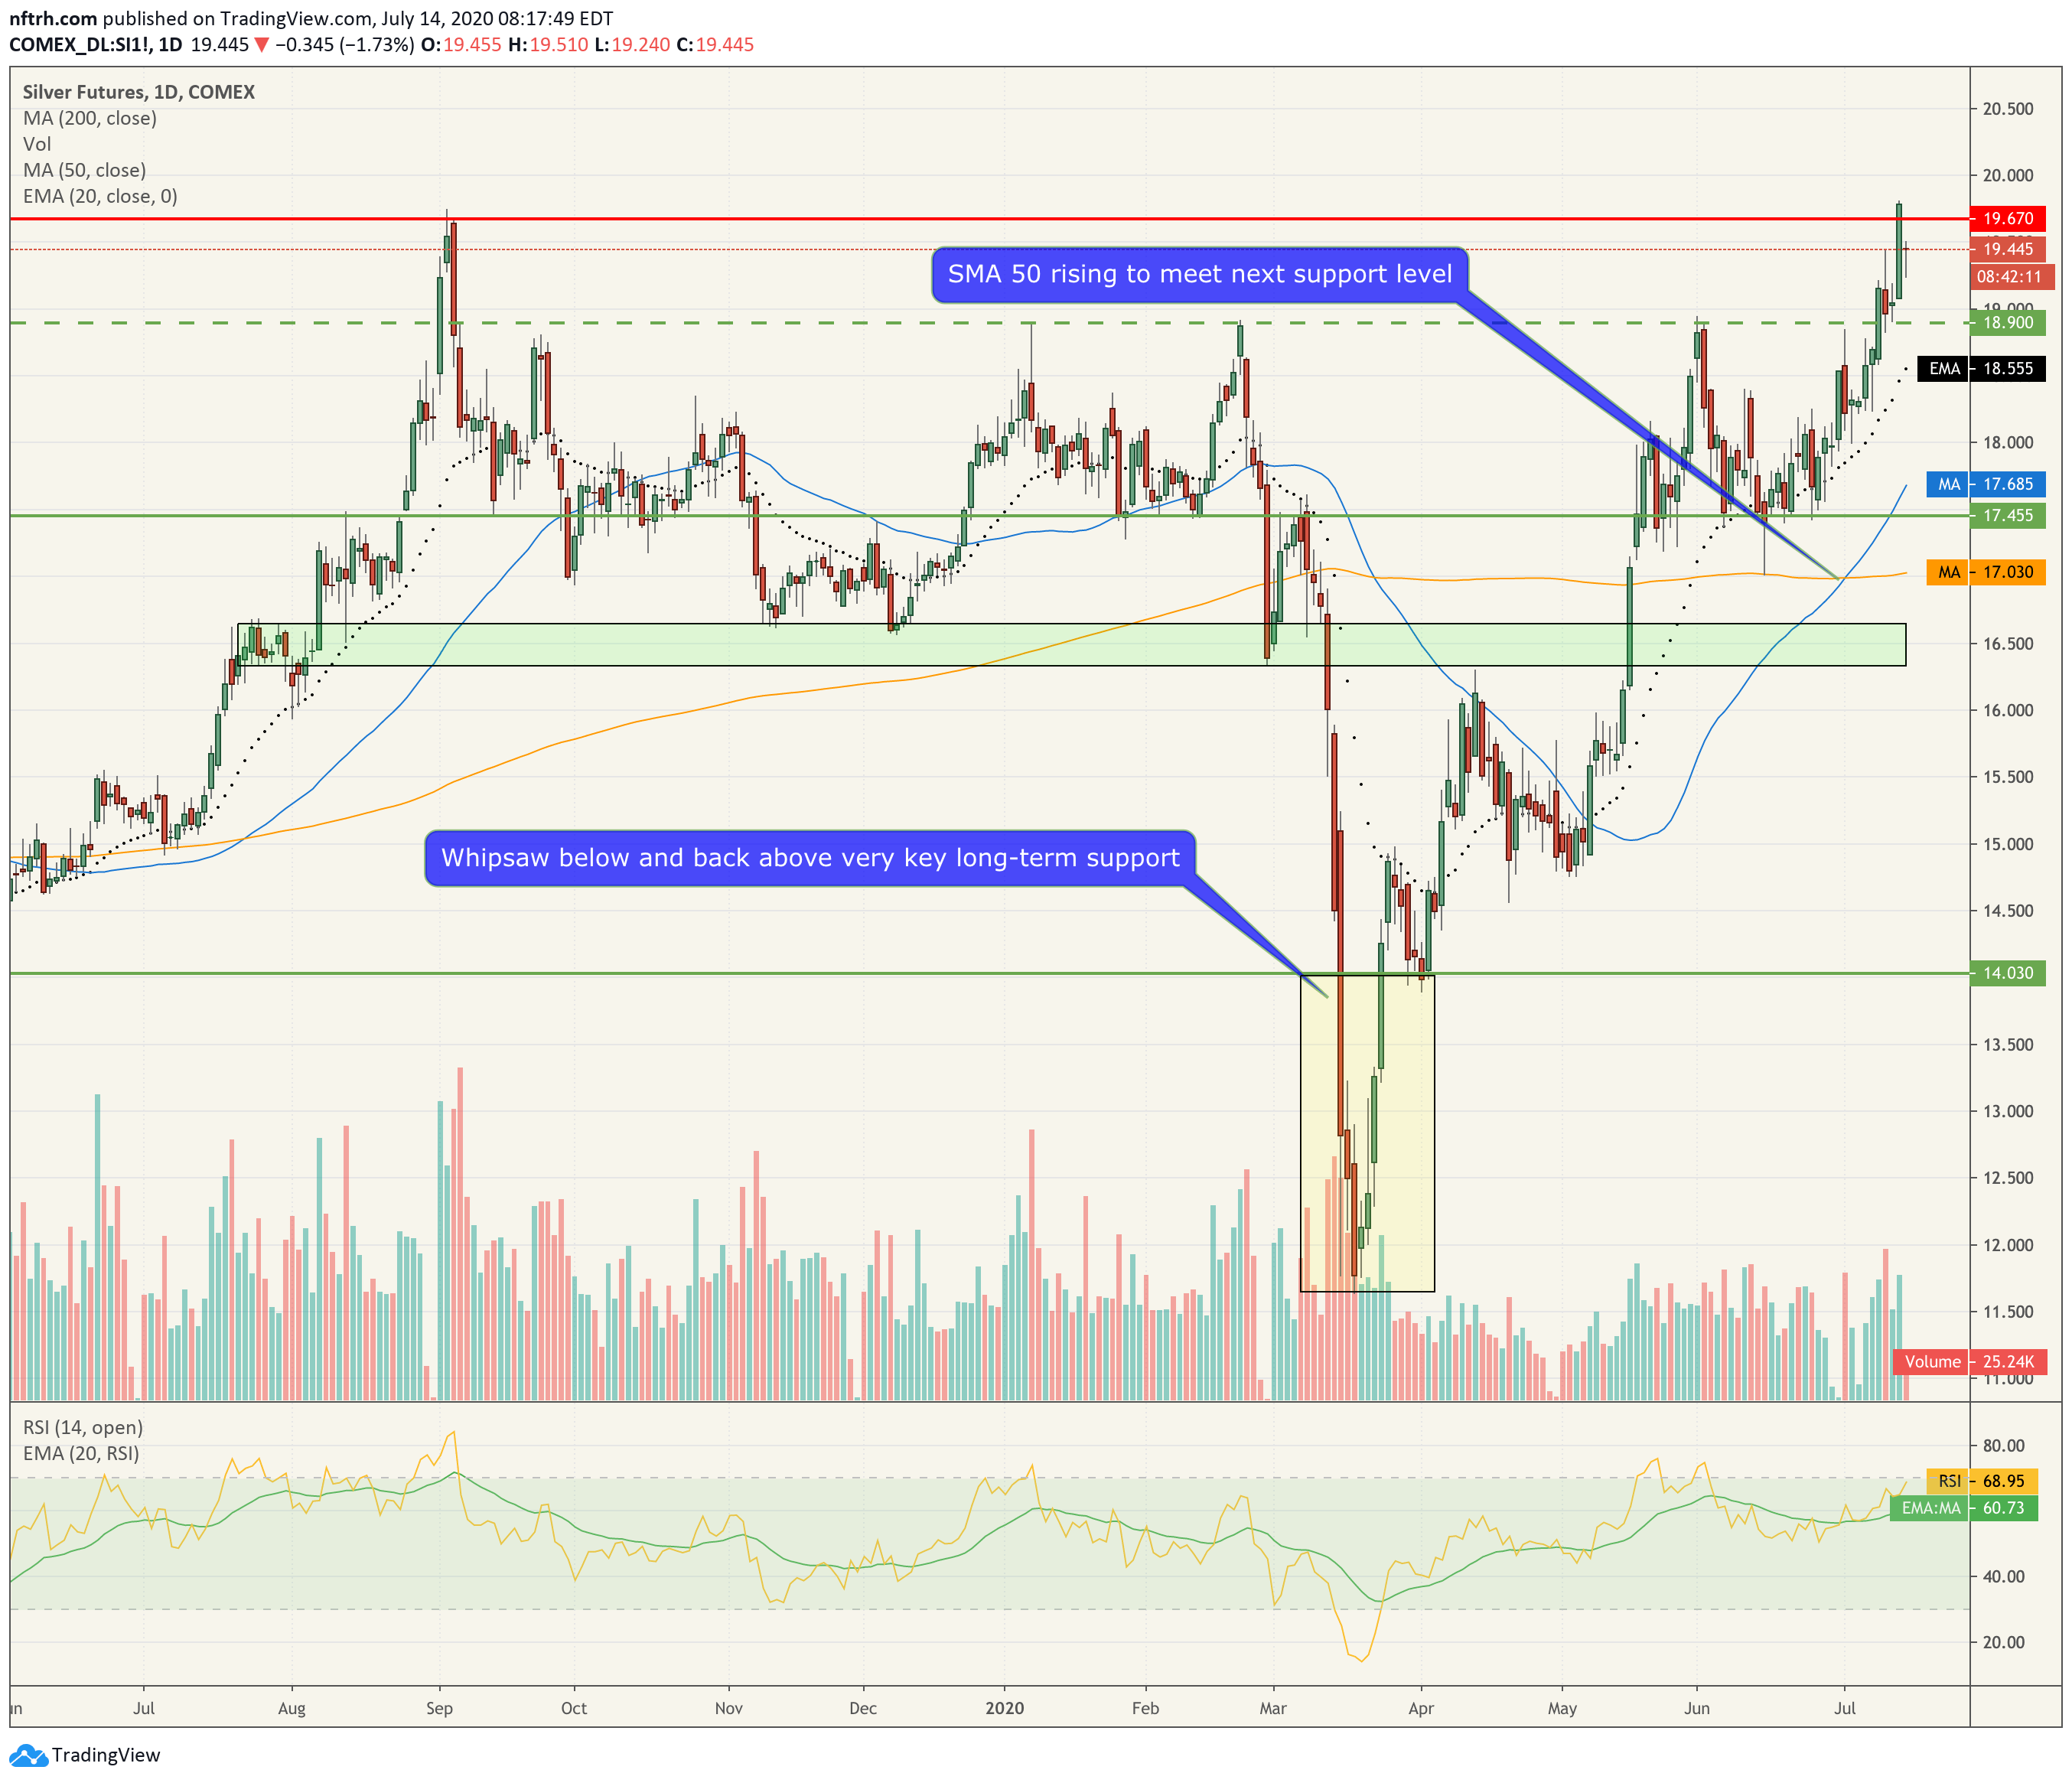
Meanwhile, sleepy and content gold (daily) is down this morning but ambling on its still-bullish way.

Silver (daily) harpooned the key 19.70 area yesterday and pulled back. It’s down this morning as well but like gold, is still in the same setup it was in yesterday morning. All that happened yesterday was that a resistance point did what it was supposed to do.
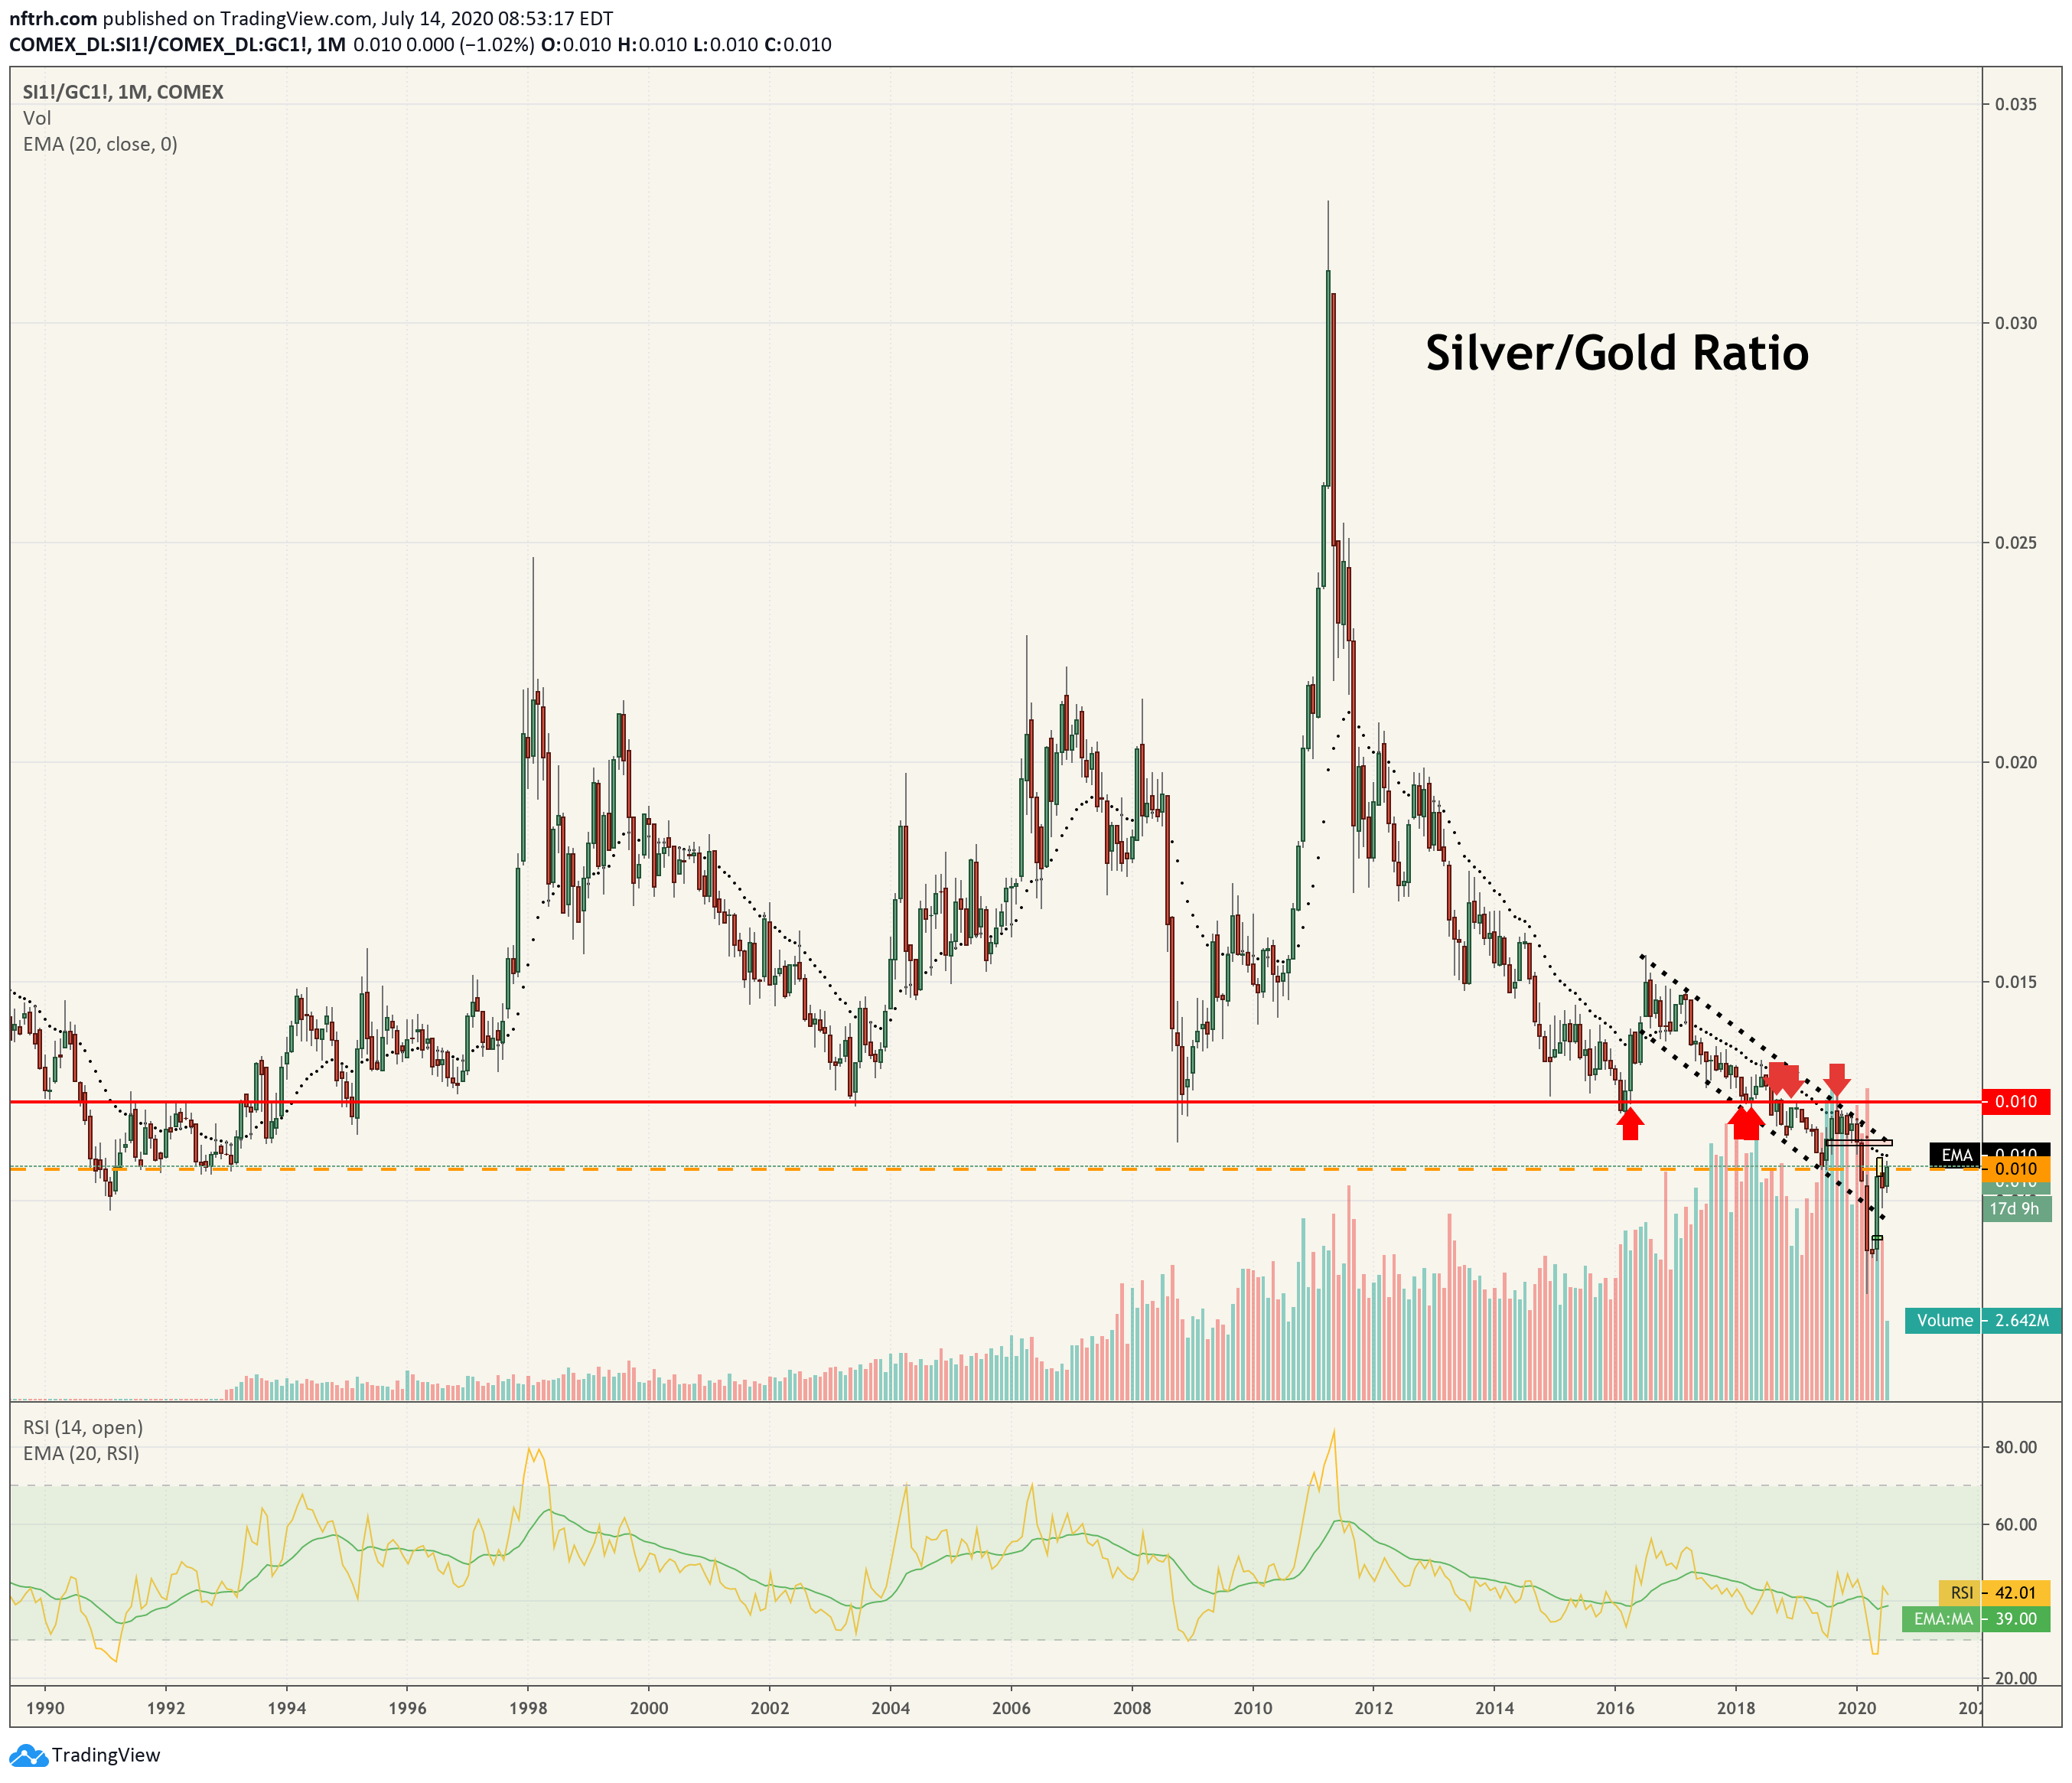
Finally, the Silver/Gold ratio (daily) also maintains its status as it pulls back this morning. It is constructive but down trending. If the move above the down trending SMA 200 is real we look for the channel top and then quite possibly, the noted resistance area.

The weekly chart again shows that area as stiff resistance. I would think that if Silver/Gold were go that high, it would bring copper to its bull gateway at 3.32.
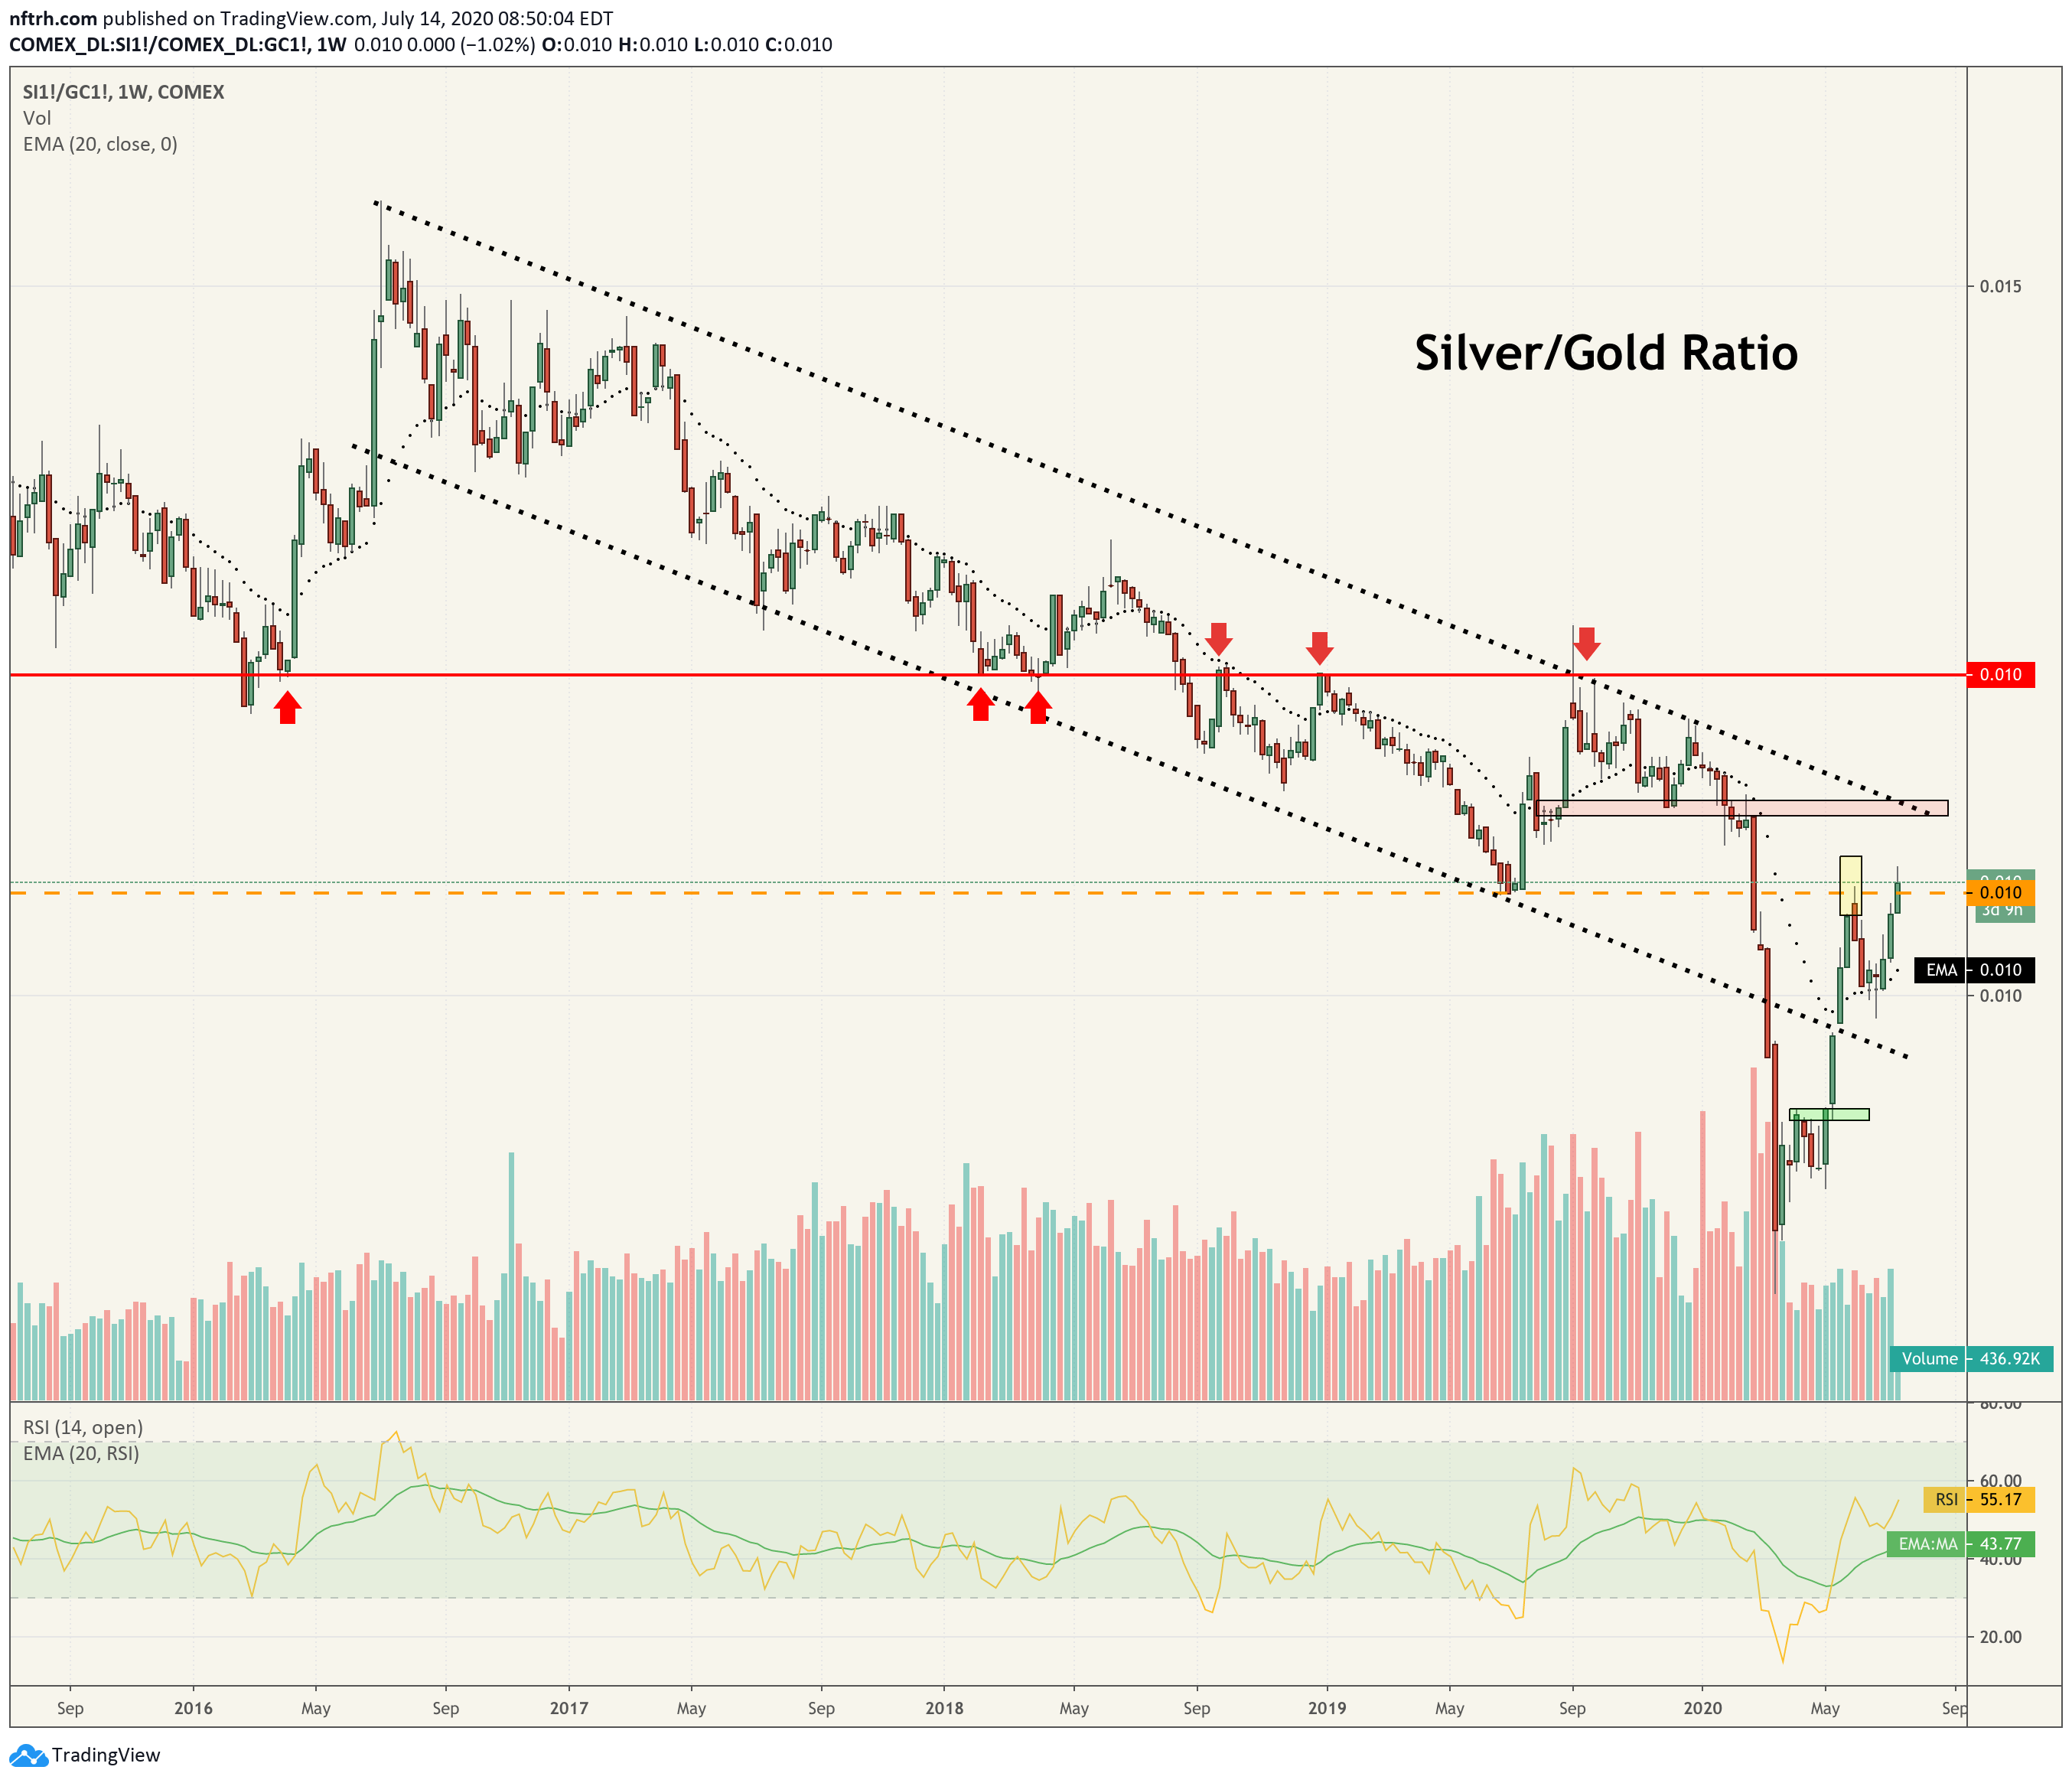
This monthly chart is actually quite terrifying to a long-term macro positive view. We have expected a snap back in silver vs. gold, and even a rise to the upper resistance on the charts above is simply part of that snap back. What this picture tells me is that sure, we can have an inflation trade of moderate intensity, but policymakers’ ever more desperate attempts at inflation are failing miserably on the big picture. All the ammo they expend and this is the result? That is not good. Not good at all.