Some words and several charts to take a reading on the status of the macro bounce.
SPX turned down from resistance and will try to find support at the SMA 50 (2969) and/or the SMA 200 (3020) after easing below the EMA 20 (black dotted line). It has not filled the immediate gap or the upper gap and remains vulnerable to all those lower gaps eventually. RSI is unpleasant.

NDX, which has been the leader, continues to say “what, me worry?”. But it may be headed for a test of the EMA 20 and key support noted.

As we noted in the last couple of NFTRH, VIX is on a divergence that is cause for caution about a coming correction. The issue here is that it is not a good ‘to the week’ timer. VIX is positively diverging inverse SPX, but since 2018 such conditions have gone on for extended periods twice and fairly brief periods twice before a correction manifested.

The World (ex-US) does not look very good as it finds resistance at… resistance. If it drops below the EMA 20 the next objective would be the SMA 50 (41.23) where there is short-term support (not drawn in). ACWX has not even gotten above its SMA 200, unlike the US indexes and is technically vulnerable.

CRB index is trying to hold the EMA 20 and as such, the bounce drags on. We are indicated to only be on a bounce, however, with the moving average trends down.

Yet the commodity headliner that many people look to, copper, is still firmly in rally mode. Recall here that it too is only indicated to be bouncing as yet by the weekly chart reviewed in NFTRH reports. Copper would be in business if it takes out 2.90 and holds it. Meanwhile, it’s not in business, it’s on a bounce.

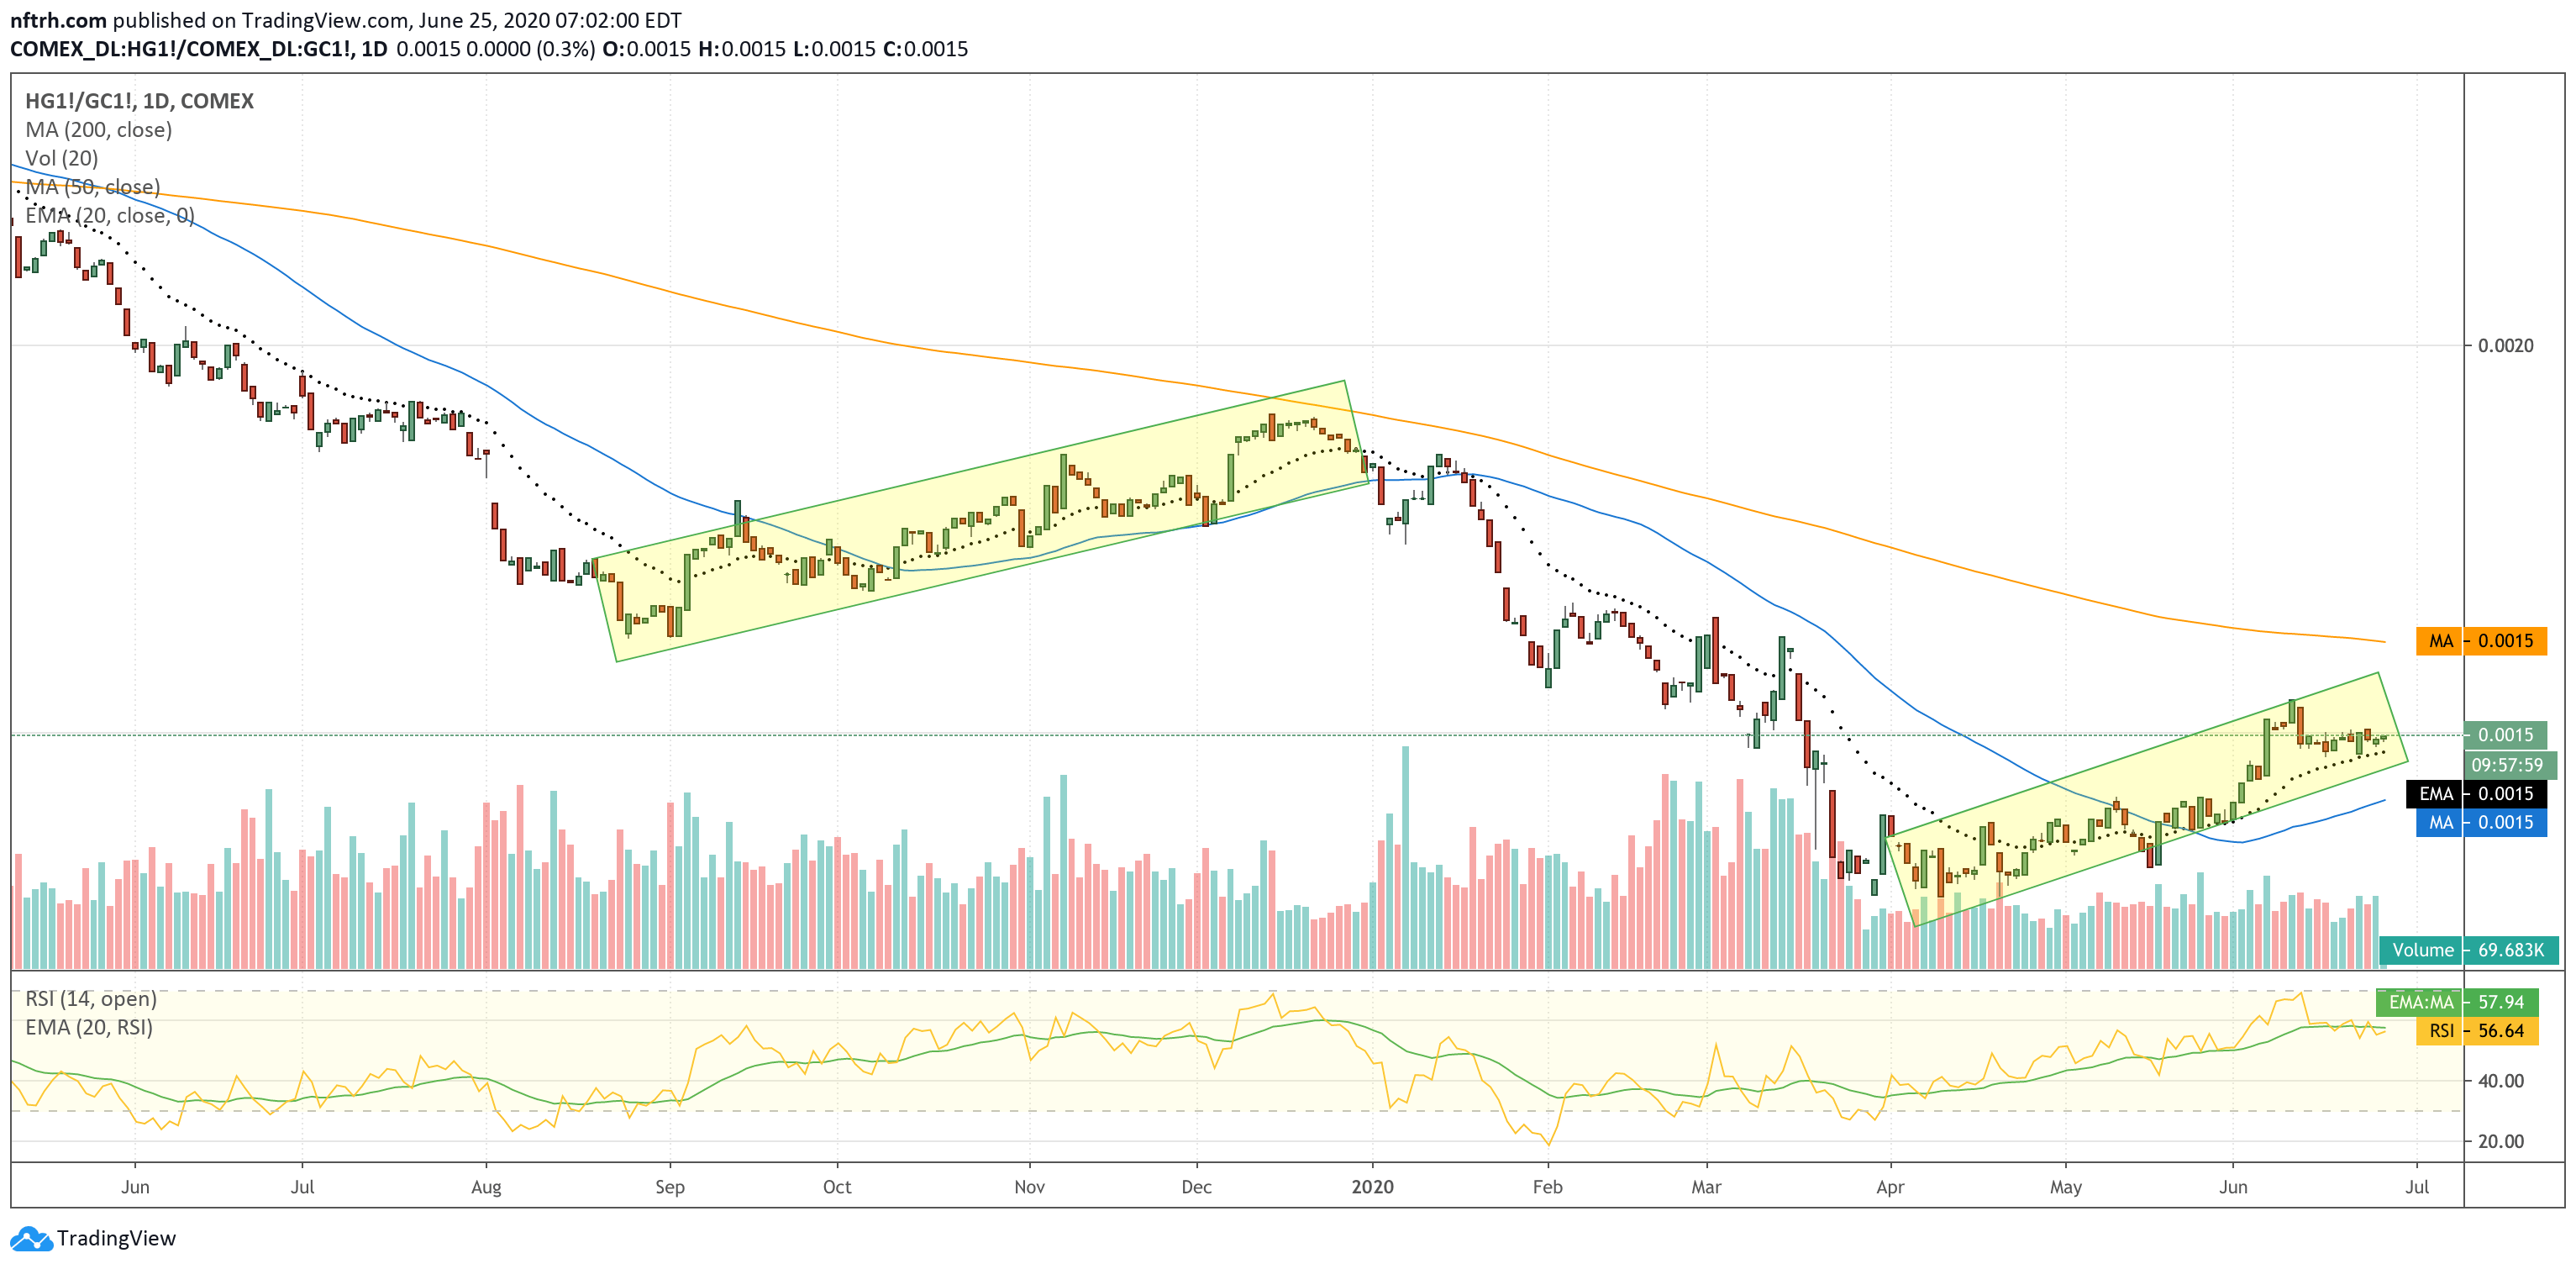
And the copper/gold ratio is still in bounce mode as well, but that is all it is right now. Relief. When copper trends up for real vs. gold a successfully reflating macro would be indicated. It’s not trending up aside from the post-March incline.
Gold broke above the consolidation line in a bullish move earlier this week. Now that appears to be getting tested. It’s a very important test. What we can say is that gold is 100% technically intact with potential to end its consolidation/correction. Now, if some of the ghost stories the promoters tell come true gold could get torpedoed with this having been a head fake. But until the technicals break down that’s all those are, ghost stories. The orange dotted breakout line (1756) and the black dotted EMA 20 (17.43) are the very short-term areas to watch.

Silver remains in the unattractive short-term pattern but above support. Next key support would be the converging moving averages at the SMA 50 (16.77) and the SMA 200 (16.99).

The miners (GDX) have not as a whole taken out short-term resistance. We wanted to see point 1 taken out, and it was. Resistance was found at point 2. This is the miners’ opportunity. Broad market pressure is not helping, but the short-term trend line was broken to the upside and the price is above both up trending SMAs (simple moving averages, 50 & 200) without an overbought condition. Downside gaps aside, GDX should hold the SMA 50 (33.72) if this is going to be a real break from consolidation.

Gold/Silver ratio and USD are still bouncing together. The SMA 50 on the GSR lines up with very long-term resistance (not shown on this daily chart) and that will be the point where we find out about continued pleasure or oncoming pain in the markets.

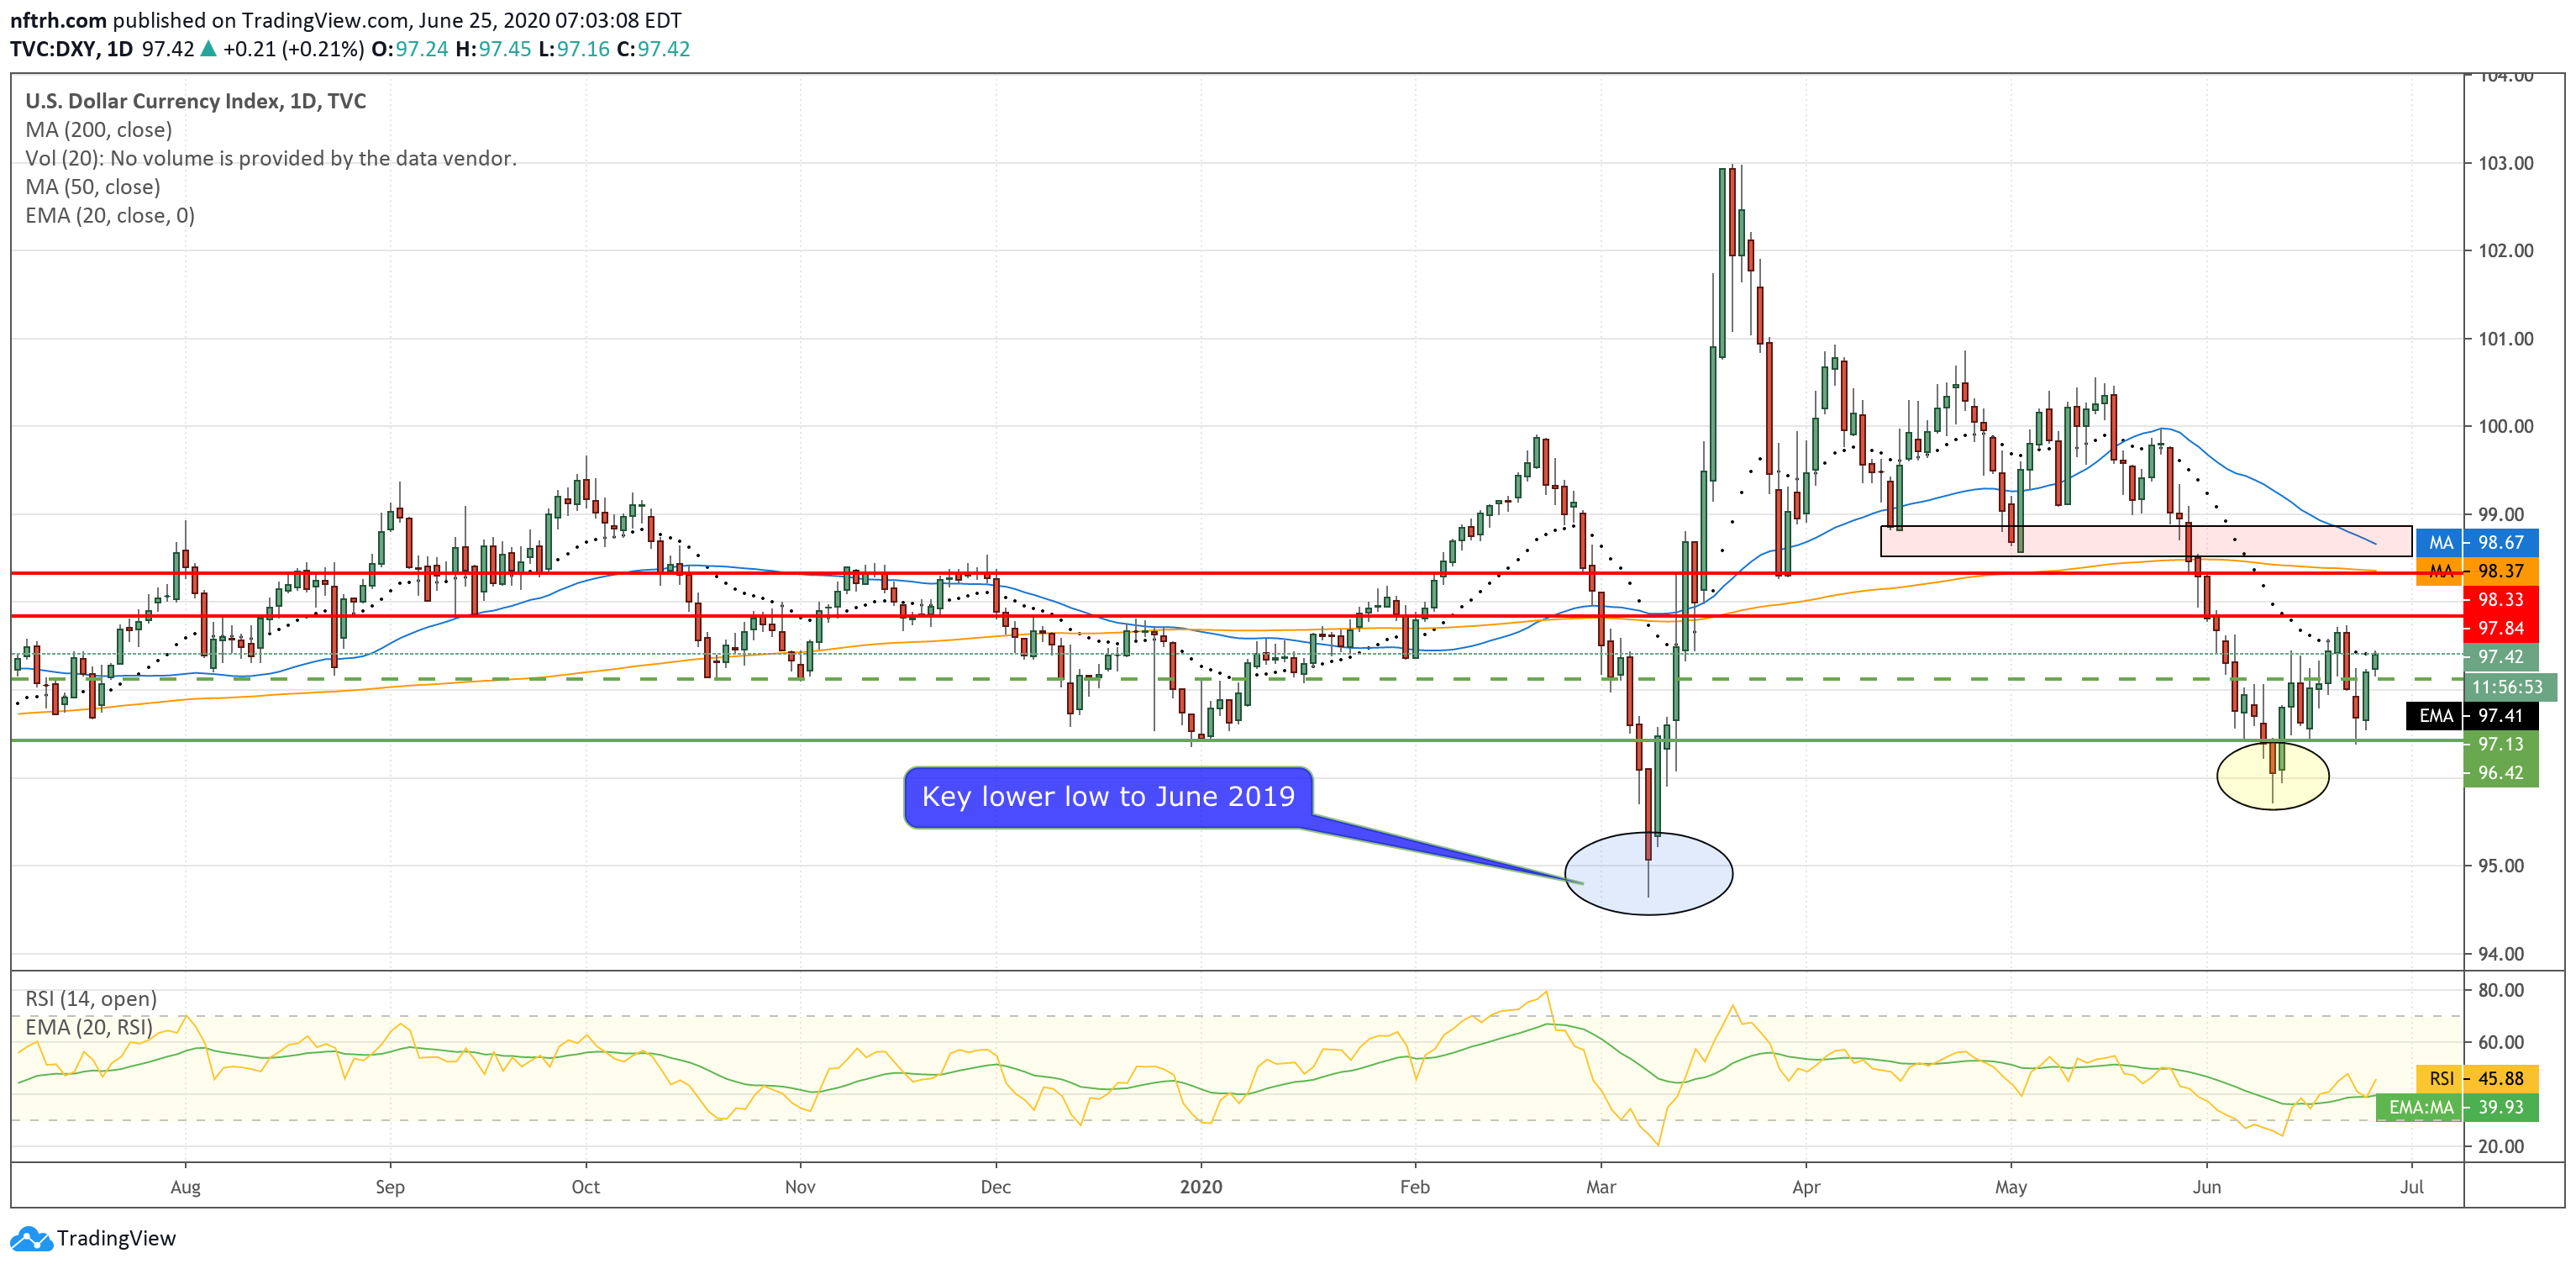
Here is Uncle Buck, also bouncing toward resistance. If these last two items move for real to the upside we’d be in extreme caution mode on the macro and possibly have a level of caution on the precious metals as well. But I think that the work done post-March may have served to insulate the sector to a better degree than at the March crash.