SPX has negated the minor slip below the January high we noted in NFTRH 516. It is back above that level and today made a move to break a short-term trend line. At this point all it has done is dip to fill a gap and it remains bullish. The target, if this condition holds up is above 3000.
Dow is flagging above the support line it made when it got above the February high and so remains a candidate to fill its January gap and test its high. But if SPX goes higher so too will the Dow. For instance, this chart targets around 28,000. I don’t instruct ’em, I just read ’em. The green dashed lines on both of these items are the dividers between failure and continuation. So far, the status is for the latter.
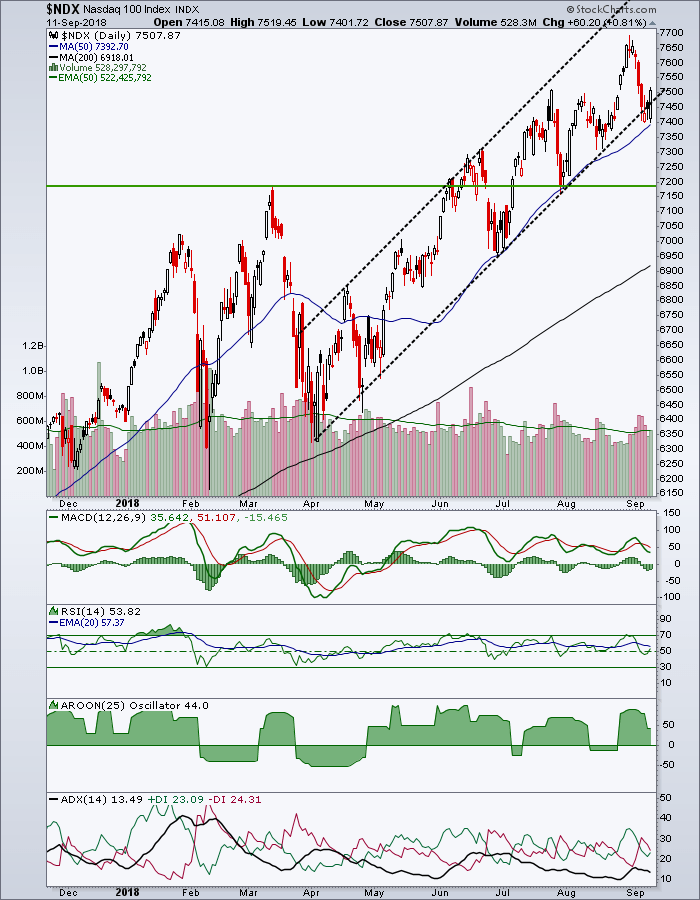
NDX was noted in #516 as having important support in the area of a Triangle breakout line (not shown here) and the SMA 50. Today it tested the SMA 50 and well, I bought the QQQ.
Bottom Line
There is a reason we use charts. It is not to predict the future but charts do tell us what is happening and these charts report that as of now supports have held, trends are up and short of a reversal, targets are higher. As they stand now, these major US index charts are as they have been since the spring; trending up and bullish.


