HUI acquired the 220 target today, hitting 220.22. I want to stress again (said the broken record) that targets are not stop signs. They are reasonable projections made well ahead of time. So please don’t read ‘he’s calling a top!’ into the process. Traders who had planned to sell if HUI hit 220 should be doing that. I am not a real trader here (though I often wish I were). I am a re-balancer, hedger and partial profit taker.
For instance, I took profit on SAND and trimmed positions in SVM and NGD down to size. NGD especially, had grown rather bulky. But for balance, BTG (IKN’s top pick) was added to replace SAND (also with a positive view from IKN). BTG has been a laggard, so I said ‘fine, Mark still has faith in you and I think your chart is now prospective (as noted in NFTRH 463)… so come on aboard’.
The reason I am not trading out of the miner rally is because I believe we have a good likelihood of a 2nd bull leg to the 1st move in January 2016. It has been a long, hard road for this sector, we have been tracking the positive divergence in some miners and the bullish big picture look of the HUI/Gold ratio for months now and what’s more, the most important chart I know of is starting to go bullish across the board. That would be the chart showing gold vs. various global stock markets. This is essential for a bull view on the miners and this week gold is making a move vs. US and London stocks, joining its constructive status vs. everybody else.

We had also noted that another key would for gold to break upward vs. Emerging Market and Junk bonds. This week that is happening. Gold is now bullish or constructive vs. all types of bonds. Now consider that bonds have been bullish nominally, and that means something.

In short, the sector’s macro funda are coming in line.
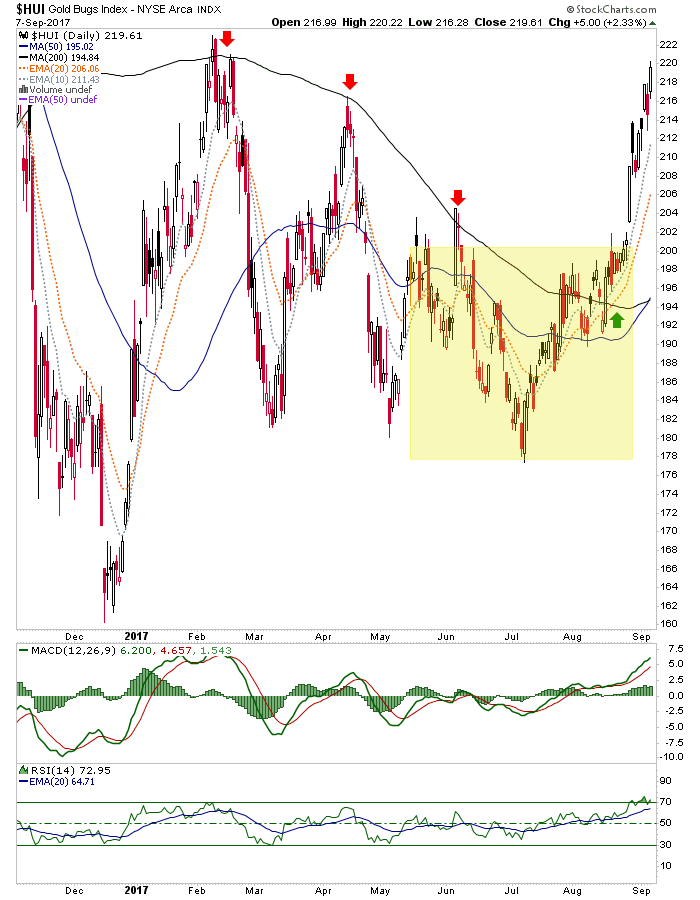
Here is the overbought daily HUI, hitting 220, which was the shaded pattern’s measurement. I’d noted that I’d hedge if Huey started to decline (I am already indirectly hedged by being long the USD) or in the more likely (per my guess yesterday, anyway) event that it went to or through target. I’ve not added any hedges but will likely do so (or take more profits) if I see hysterical overbought bottle rockets going off.
But the macro charts above get me thinking more like an investor. So too do HUI’s weekly and monthly charts. They remind me that a real bull move would make the real money by doing more sitting (yes, like Old Turkey in Reminiscences of a Stock Operator) and less trading along the way.
This looks like an impulsive move putting the old bear market ball and chain, the weekly EMA 55 (orange dotted), in the rear view mirror. I’ve added RSI to the weekly to show that it is not overbought on this time frame. The implication is that any pullbacks will not be rally enders as long as the 195 area holds (EMA 55 is 197). So the weekly can get toward overbought and the daily can get even more overbought near-term, but when a pullback does occur it should look like a buying opportunity (with a handy mental stop loss below HUI 195).

The monthly chart is getting overbought by Stochastic RSI, but on a monthly it can remain that way for many weeks, even months. The thing that blows me away is that it held that damned center Bollinger Band line just as we’d thought might be the case going all the way back to late 2016. Now the consolidation handle is breaking and as shown in a public post this morning, the pattern could be morphing into an Inverted H&S.

HUI/Gold ratio is looking good by daily, weekly and monthly time frames. Here’s the daily.

Here’s the weekly.

Here’s the monthly.

Here is the daily chart of gold we used first to project a ‘bounce’ to 1300 and then upon breakout, a measurement to “near 1400”. At 1350, it’s now more than half way there since the breakout above 1300. I for one have not been expecting it to take the upper 1300s to 1400 all in one big gulp. And to me, that continues to be a vulnerability insofar as it is driven by panicky momentum players piling in due to geopolitics. Frankly, it makes me uncomfortable. But then, in real life – as opposed to my analysis – I am a pretty emotional person.

The monthly again reminds us that gold is perched just below a potential battle zone. Can it be that easy? Can gold slice through a marker to its new bull market leg without any trouble? Will it? Only your local gold guru knows for sure (and he’s always bullish). I think it’s a potential war zone (pardon the pun).

Silver’s target has been around 18.50 off of the pattern that formed from June to August. It hit 18.22 today.

Bottom Line
Positive:
- The HUI short-term target is in the books, and gold and silver are nearing targets and resistance; but the move looks impulsive, like a launch to a new bullish phase (subject to pullbacks/buying opportunities).
- More important macro fundamentals for the sector are going positive.
- Gold miners are leading gold (and silver has been leading gold for 2 months as well).
- Weekly and monthly charts are showing breakouts and bear market chains (like the HUI weekly EMA 55) being put in the rear view mirror.
Negative:
- North Korea fears driving the sector to some degree; the fallout always comes, sooner or later. The thing is, when momentum is in play logical timing goes out the window.
In light of the fundamentals, which are my judge and jury on whether to be bullish the sector in a meaningful way, I am willing to accept for now the funnymental known as the North Korea angst. Along with that, the technicals are the technicals and they are bullish or very constructive in all time frames.
What works for me (a very different investor from you) is to not be buying (other than the likes of laggard BTG, which replaced one sold for profit taking) but rather, holding steady with some profit taking and balancing, but keeping core positions. A correction and buying opportunity will come and I’d hope to be able to have an ‘ah ha!’ moment (like a wild upside blow off) and spot it ahead of time. The kind of thing where you’re compelled to take more profits.
Traders however, if they’ve honestly assessed their goals ahead of time, should be selling now if they, like me, thought HUI 220 to be a reasonable target. Nothin’ wrong with profits, folks.
As for me, I’ll just end up managing as best as possible (and letting you know my thoughts along the way) with the idea that on the bigger picture, something real appears to be going on here. I’d hope to take enough profits right on the nose of the rally, but that always sounds easier than it ends up being. For now, I am going to be patient, trim a profit here and maybe even hedge a bit there. But the bottomest line is that this thing seems real, as in the next leg to the thing that started in January, 2016.
A final consideration is that there is a lot of talk about a market crash and the ‘years ending in 7’ stuff going around. I don’t have grounds to forecast a crash so I am not going to do so. I only have grounds to anticipate a correction for 2nd half Sept. and Q4. But if an epic crash were to happen there would be validity to the idea of a liquidity crisis taking all stocks, including miners, down; at least temporarily.
Apologies in advance for the talkyness of the update. Some of them go that way. I hope that by me working through my stuff it can help others work through theirs as well.