I am not recommending people chase the Energy sector now because it has bounced vigorously since Monday’s down day, when I bought it, and when subscribers could have considered buying it. The reason I bought it is outlined in this segment from NFTRH 440, which followed our regular, more broad-based US Stock Market segment. This is just a bounce at this point and should the sector pull back again, people might want to take a look if they find this deeply out of favor sector of interest. From the March 26 edition of Notes From the Rabbit Hole…
Energy Sector
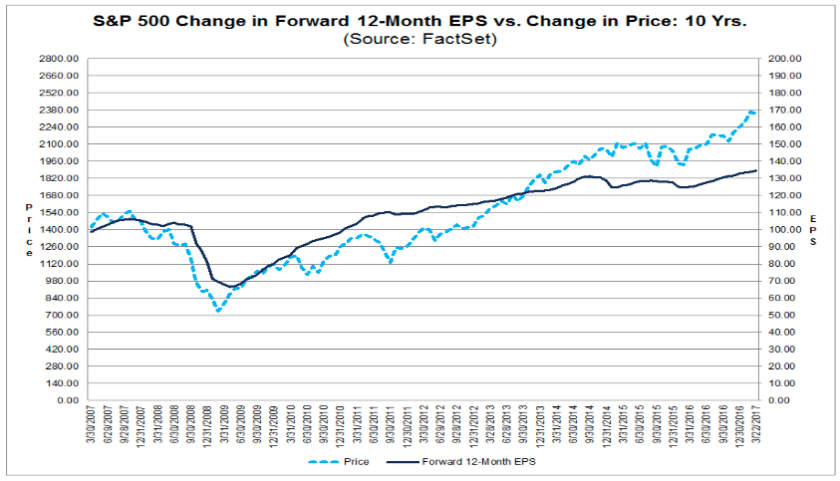
In the US Stock Markets segment we noted that the Energy sector has dropped to notable support and that is where Energy bulls should be paying attention. What I mean by “Energy bulls” is people who’ve done or accessed research that comes to a bullish or constructive conclusion and want to invest. To that end, both FactSet and Knowledge Leaders Capital (formerly GaveKal) come to my inbox this weekend with analysis of the Energy sector. Let’s begin with FactSet. Below are the overvalued S&P 500 per its forward earnings, and the Energy sector details.

This positive projection is of course due to oil prices that had been rising, along with easier ‘comps’ to Q1 2016 earnings. Crude oil has declined harshly of late and so too, logically, has the sector.
Let’s check in now with a daily chart of WTI Crude Oil. Aside from showing us how cruel this market can be to those going only by charts (as WTIC got above a bullish looking pattern’s neckline, and stayed there for about 3 months before failing) it also shows these facts.
- A sloppy series of higher highs and higher lows is in play since the low in February of 2016.
- RSI has dropped to an oversold level that sprung the last 2 bounces.
- The last 2 oversold readings on RSI have had a distinctly different character than the 3 bear market readings leading into the 2016 low as they did not become as deeply oversold.

Indeed, Crude Oil could be at a point where it can decide whether it is exiting its cyclical bear market if it were to find a price bottom at or near the green trend line and move back up from current oversold readings. If such a bounce occurs, a new high would pretty much put a new cyclical bull market in the bag, if it’s not already in there.
From Knowledge Leaders Capital, a look at the deeply oversold status of their Energy index. It is getting to a level that has sprung bounces and bull phases in the past.

Capital spending has been cut even further than it was after the last ‘great’ recession. Compare this to the XLE chart in the US Stock Market segment, which still looks constructive. Is the sector exiting its own discrete recession with the market looking forward? Meanwhile, the 2nd graph shows world oil consumption steadily rising, unabated.


For the full version of their investment thesis, which is basically that if the US stock market continues to correct the Energy sector may incur relatively less damage and may even act as a “defensive” sector, see the entire post Characteristics of Capital Preservation: A Look at the US Energy Sector.
Meanwhile, here is the (updated) monthly chart we used to highlight XLE in long-ago NFTRH+ updates like this one from January 6, 2016: Energy Sector: Future Buy Level (Reminder).
We made a buy projection at the end of a cyclical bear market within an intact secular bull market. We also noted the resistance zone (which ended up containing the 2016 up leg) back before the rally even started.
I am not tooting my horn but I am trying to illustrate that what has gone on has all been readable in a simple monthly chart. The question now is whether the current pullback is going to halt at support in the 65 (+/-) area or go lower. Remember, it can drop to the channel bottom and still be an intact secular situation. A lot, in my opinion, will have to do with the broad market and whether it takes a mini or maxi correction.

Subscribe to NFTRH Premium for your 30-45 page weekly report, interim updates and NFTRH+ chart and trade ideas or the free eLetter for an introduction to our work. Or simply keep up to date with plenty of public content at NFTRH.com and Biiwii.com. Also, you can follow via Twitter @BiiwiiNFTRH, StockTwits, RSS or sign up to receive posts directly by email (right sidebar).