I try to stay fairly quiet pre-FOMC because the event is so keyed upon and often acted upon by man and machine. But it can’t hurt to do a simple review of a few items, in a vacuum away from the influences of the news of the day. One unexpected decision by the interest rate manipulators could take the charts, crumple them up and set a match to them.
Actually this morning Japan’s rate manipulators have kept the rate unchanged and introduced tweaks in order to stimulate inflation. The market cheers. This may by the way, have an effect on the Japanese banks we spotlighted (MTU and SMFG), which have already begun to bounce after pulling back to the projected support areas. But back on theme…
Over the last couple of days they tried to bull the stock market, only to see it fade during the day. This morning is green as well. None of it means much yet because…
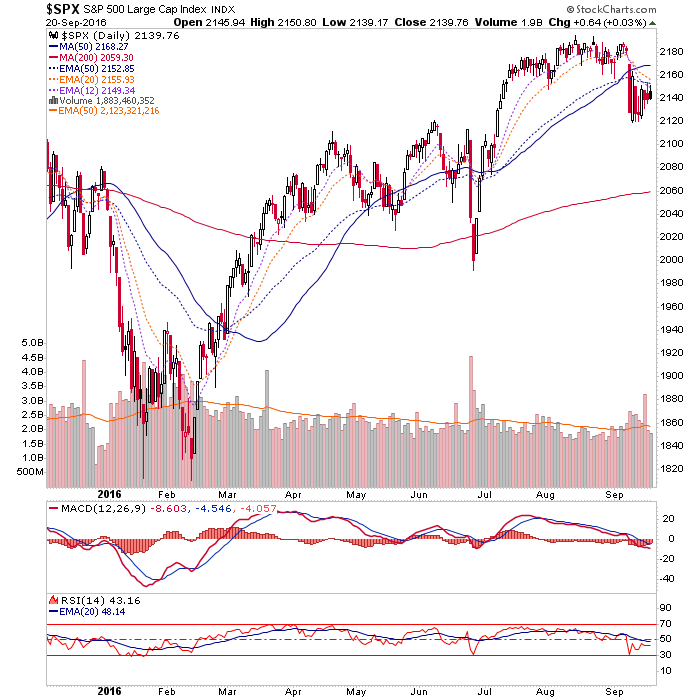
SPX has been limited by the (blue dotted) EMA 50 and the shorter-term averages (EMAs 12 & 20) since crashing through the SMA 50 last week. If it breaks and closes above the 3 dotted lines it could set its sights upon the SMA 50, filling the upside gap and who knows, even ending the correction. Meanwhile, the short-term trend is down and the most reasonable target continues to be toward the SMA 200 in a range of 2059 to 2100. When we originally projected a pullback the target was a blunt 2100 (+/-), which I suppose we could say is already in. But again, the short-term trend is still down.
HUI, like SPX continues to look to the SMA 200 as the preferred support area. This thing is rising at a nice slope and now resides at nearly 197. That would fill the June gap, satisfy the weekly chart’s EMA 55 and tickle long-term support as well. As with the stock market, gold and silver are positive in pre-market and as with the stock market, it does not mean much until they take out the SMA 50 (silver has bounced to its SMA 50 in ‘pre’ and gold is still dealing with its EMA 50 and shorter-term MAs as per the SPX above).
A lot of good downside work has already been done in the precious metals mining sector, but the chart continues to generally target the SMA 200 because it is in a short-term downtrend as long as it is below the EMAs 12, 20 and even the 50 to boot.

Now let’s see what drama unfolds later today. As usual, I am remaining balanced and not taking the bait from the market during a period of increased energy and the whipsaws it can produce. I am neutral (with bullish bias, because that is the larger trend) on the stock market beyond this pullback and bullish on the gold sector beyond this correction. October is an FOMC void month and so I want to see what comes out of this meeting, either in policy or jawboning (expectations management) before fine tuning the picture, which we will surely do this weekend.