Stock Markets
US stock markets probed a bit further into the resistance (and if current analysis is correct, topping) zone equivalent to SPX 2000-2030 yesterday, closing at a new recovery high.
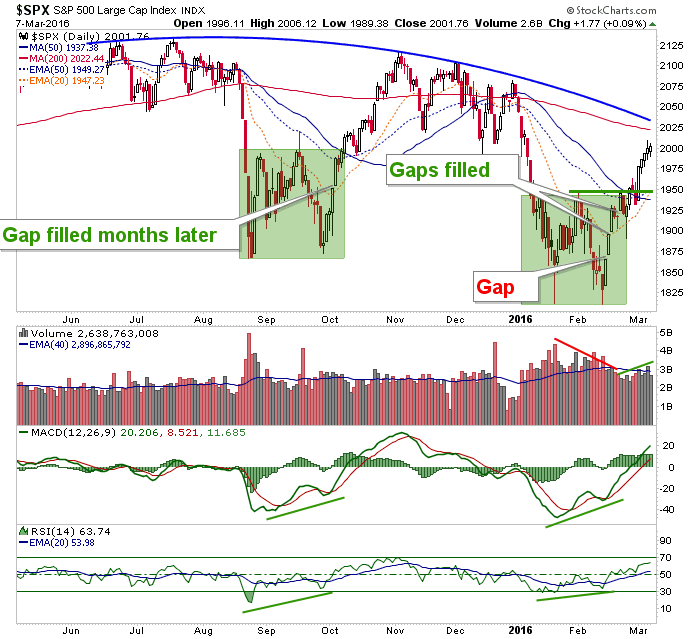
The weekly chart shows a logical hesitation at the EMA 50, but the indexes can pop above that moving average as was the case in October.

Either way, it remains a bearish stock market, technically and the risk vs. reward on the bounce has degraded significantly from the time is was appropriate to expect a bullish reaction.

I am hearing people talk about why the charts don’t matter so much and the backdrop is a healthy one for the bull to resume. There are ‘quants’ also working the theme that historically, phases like this have yielded bullish results some months out. That is what you are going to hear during a bounce that exists to repair people’s frayed nerves.
I agree that things are not so bad economically, but they were not so bad in 2007 either, when the stock market topped. I also agree that some months out we may see a nice longer-term buying opportunity. But until the trends change as reflected in the charts above, the primary target for SPX continues to be 1500-1560.
The bottom line is what it has been; for some reason the stock market went bearish over the last year and in obeying its trends we have remained on the right side of it. Can a chart’s message be broken? Sure can. But as of now none of the charts above, with the exception of the NDX, can be called anything but bearish. If the analysis changes, we will change too. But nothing has changed. It is a bear trend.
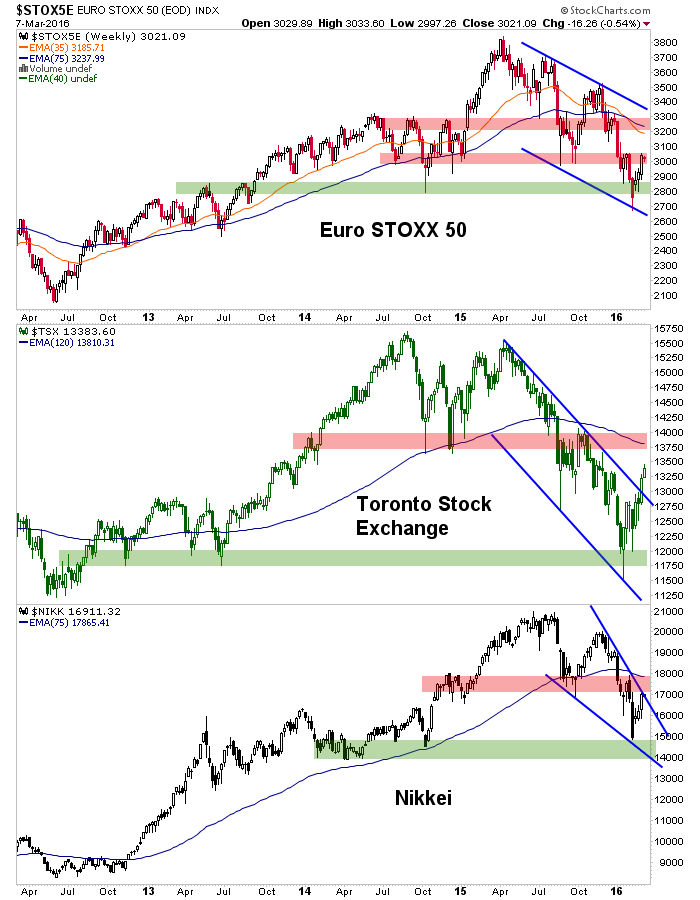
Europe and Japan are at well formed resistance and Toronto looks to the weekly EMA 120 around 13750. With commodities on a big bounce, this makes sense. TSX remains bearish below the July high, however.
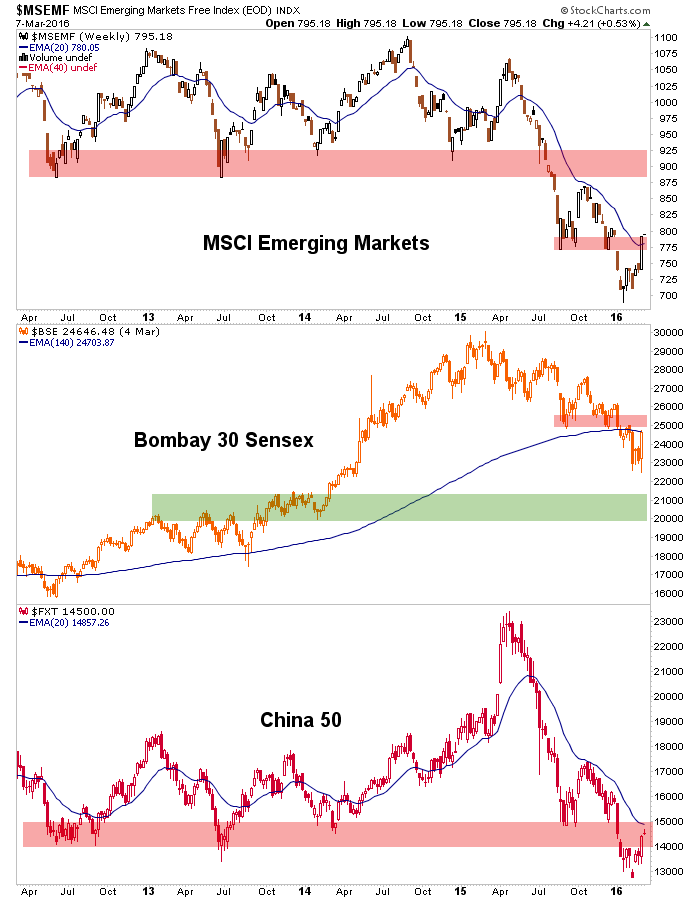
EM’s are poking above the 1st resistance while Bombay and China remain at resistance. If commodities remain in their longer-term downtrend after the bounce completes, EM’s continue to look like a good short setting up. The question is from what point? I had thought about shorting at this gap fill, but that will depend on where the anti-USD ‘inflation trade’ bounce stops.
Commodities
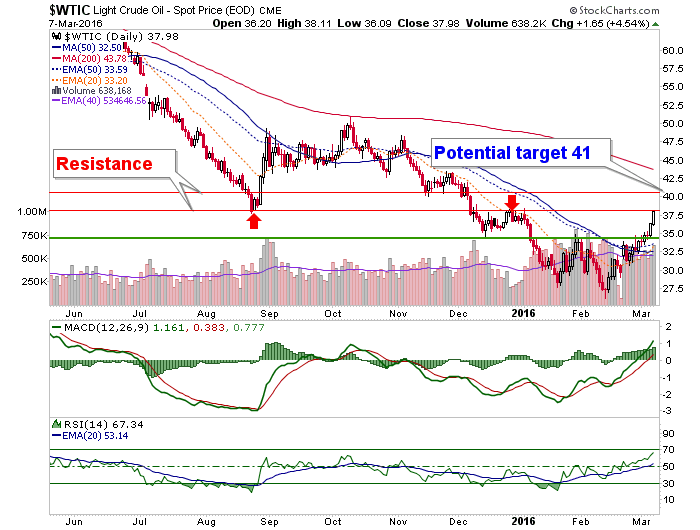
In NFTRH 385 we reviewed the weekly charts of oil and copper, which are still in a bearish trend. We also reviewed monthly charts of WTI and BRENT crude, each of which hit potential big picture bottoming areas at long-term support. But the daily shows a nice bounce and little more.
This rhymes with the NFTRH+ trade in XLE, which hit a long-term potential bottoming zone and has bounced to near the daily chart’s targets. The point being that investors may be doing one thing (accumulating) and traders another (looking to take profits). I mostly likely will fall into the latter category as I have been able to trade XLE well off the bottom. I would not have a problem re-buying higher if it meant the trend is changing.
As for crude oil, it is actually at a resistance point now, but could measure up to a 2nd resistance area per the pattern breakout. Either way, the declining SMA 200, like the weekly chart, calls this a counter trend bounce as it stands now.
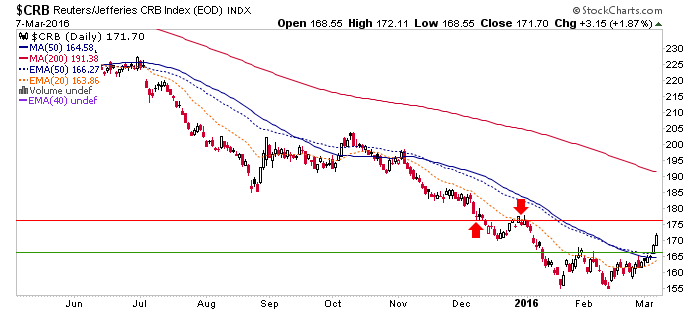
As for the CRB index, we noted the 175 area as the most likely target as the pattern measures to minor resistance at 175-176.
Precious Metals
And now, the star of our show… Gold. It has held the 1st support level and broken upward from the short-term Triangle consolidation. The next target is 1308. It may sound like a broken record, but momentum is going to flame out at some point, although momo works to its own schedule.
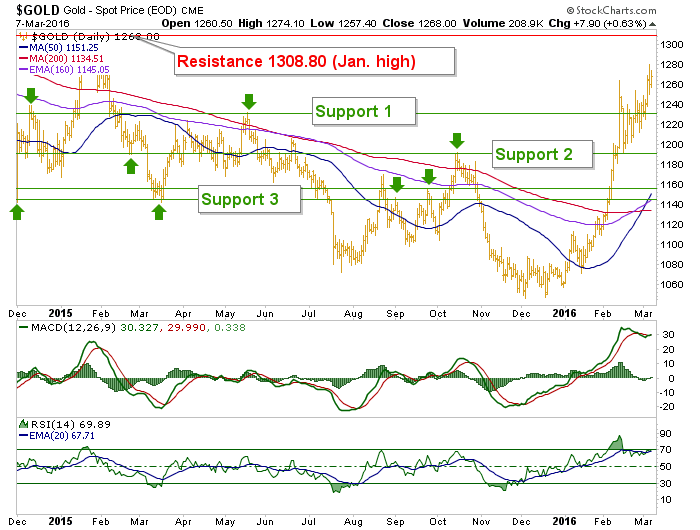
1175 to 1180 is the 1st key support by this weekly chart.

Silver is so far holding 15.50 and its next target would be the October highs.
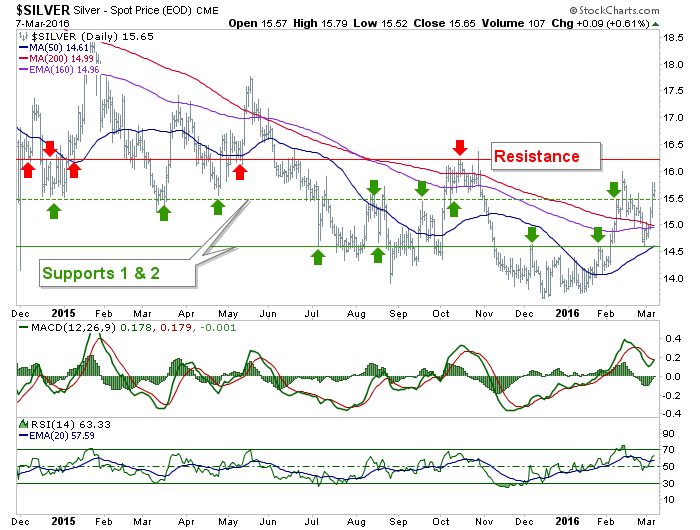
Notice how gold is well above its October high and silver is below. That continues to be a negative indicator to the commodity and ‘inflation’ bounce. All the Silver-Gold ratio is doing is bouncing and reverting to its gentle downtrend after spilling hard in February. In other words, the ‘inflation’ case is getting some relief as commodities (and the stock market for that matter) bounce, but nothing more is yet indicated.
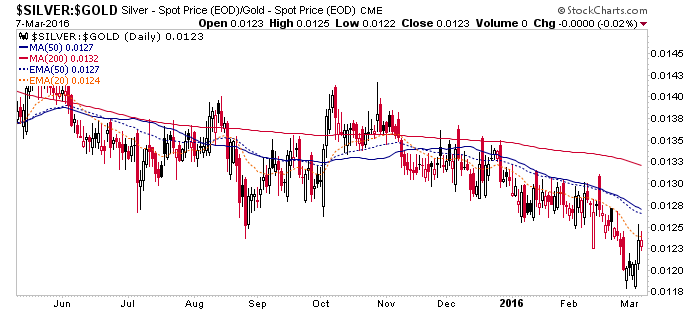
The bigger view of Silver-Gold is unchanged and still in a bearish trend.

Luckily, we are among the relative few who do not depend on inflation with respect to a bullish view of the gold miners, which also need a cool down but are bullish in their technicals and fundamentals.
HUI has attained a measurement from the pattern breakout (140-100 = 40; 140+40 = 180) and has reset its over bought RSI and MACD. Now, is that waning momentum in preparation for a reversal or for a new burst upward?
The ADX in the lower panel shows that momentum to the upside has not reached the level that downside momentum did in July into August. What’s more, it is probably best for HUI’s sustainability if it does not do so all in one big move. If it were to hit that level of momentum and become as over bought as it was over sold in July, the ensuing correction could be severe. Best for HUI to calm down here at the pattern’s measurement. But does Huey know what is good for him?
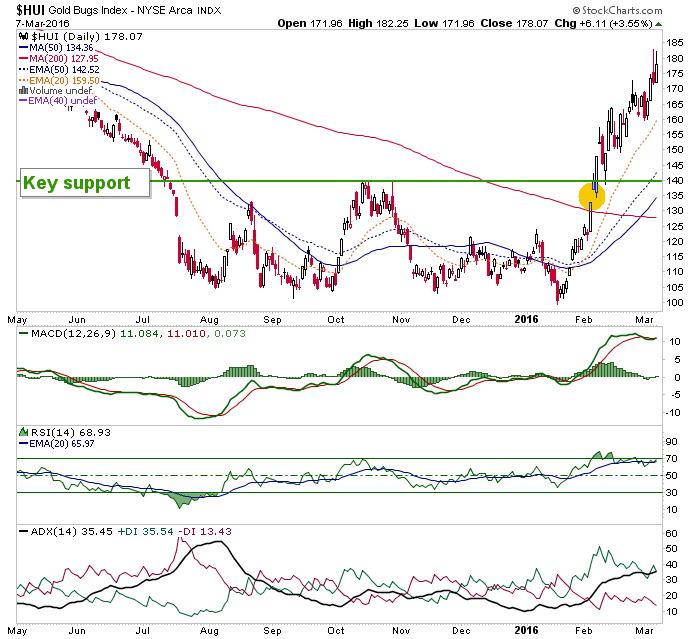
There is a ‘Golden Cross’ of the 50 and 200 day moving averages and as we have pointed out time and again, this is a tragically flawed indicator. It is all hype and usually comes after the price action has made the majority of its move, which makes sense since it is price action that creates the cross. Tune it out if it is promoted.
Weekly HUI below has broken above the channel. It also poked above it in-week back in summer 2014. The difference between then and now of course is that there are real fundamentals behind this move and the EMA 55 is exceeded.

The view remains that gold and gold stocks are fundamentally improved for real this time and technically changing their trends to intermediate up. They also continue to look like candidates for a pullback, perhaps after a ding of 1308 by gold. Meanwhile, traders can play as they will and investors accumulate as they will with these parameters in mind.