This post is being sent to the entire list (as opposed to NFTRH+ email opt-ins) because I need to check the ‘+’ list for accuracy before using it, and have not had time thus far. Also, a play on the Utes is a play on interest rates, which is a macro indicator.
The daily chart of XLU shows a clear breakout above the August and October highs. The breakout is being tested now, and that test may or may not be complete. If you have a positive view of Treasury bonds (i.e. a risk ‘off’ view) then you’d probably have a similar view on the Utilities. The chart does not care about any of that. It only cares about the break above 45 and the target of 50.
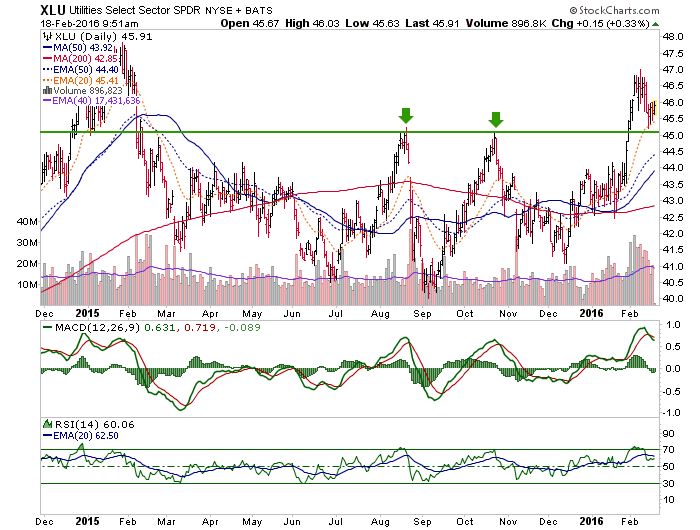
Buy Target: 45-46
Sell Target: 50
Stop Loss: A loss of the breakout line at 45 (strict) or below 44 (more lenient), which has more support and the SMA 50.
A reminder that chart based NFTRH+ updates are technical trade setup ideas, which may not be revisited as the buy, sell, stop parameters are already noted. They are meant as a starting point for further research if interested. I will not personally buy every item highlighted and will sometimes sell – without prior notice (because this takes time and resource away from NFTRH’s main functions) – any item that I do buy, below target, which is something I often do as a trader. Also please be aware that I am not a fundamental stock analyst. Due diligence is your responsibility.