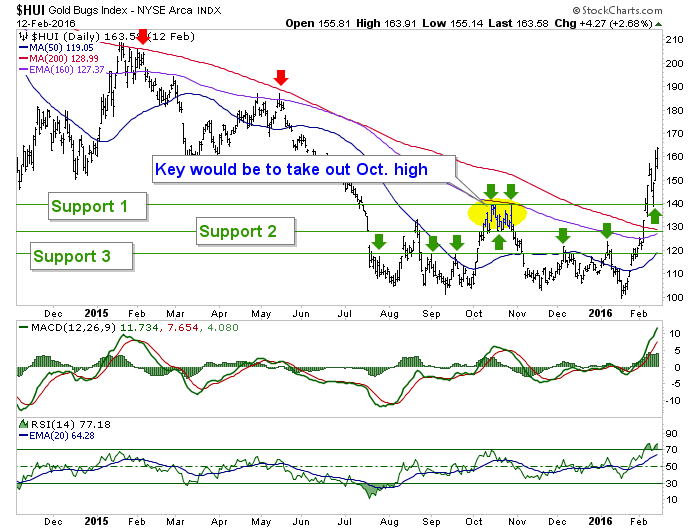
The daily charts of HUI, GDX and GDXJ below show pullback support zones as the (mini or maxi) reaction from over bought status takes hold. As noted, HUI 140 is now a more important support zone because it has been tested once. 130 is the SMA 200 and is also very important, and 120 is the SMA 50 and lateral visual support.
Very generally, if you wanted to be in but felt the miners were running away, you might do partial buying at support #1. But support #2 is also very doable as a gap would fill there (as noted previously) and a big time moving average (SMA 200) would be tested. As previously stated, I don’t want to see 120 because it would be a sign of weakness that I don’t think the miners should flash right now. But it is also doable.
GDX looks to 17 as the key level. 15.40 is also very doable at the SMA 200.

GDXJ is just above support #1. 21 looks like key support here at the SMA 200.

Just a quick visual for those who wanted a pullback from the over bought conditions. Generally, I am using HUI 120 as a mental ‘stop loss’ to a technical bull view but again, I don’t want to see it get that low because the miners should not exhibit such weakness after such strength. The best case is to just grind off the over bought, hyped up excess, potentially to the SMA 200’s.
I took another profit on LSG due to IKN’s less than stellar post-merger view. I also plan to be patient here in gauging the sector pullback.