Skip to content
Notes From the Rabbit Hole
  • NFTRH Premium
    • Subscribe: Info & Options
    • Report Archive [pw]
    • NFTRH+ Updates [pw]
    • In-Day Notes [pw]
    • What NFTRH Is, Is Not
    • Why the Macro?
    • Fundamental vs. Technical
    • Welcome to NFTRH
    • NFTRH FAQ
  • About
    • “Hammer”
    • Content Admin & Marketing
    • Copyright
    • Terms of Service & Privacy
    • Our Tools
      • Macro Indicator: Gold-Silver Ratio (GSR)
      • Macro Indicator: T-Bond Continuum
      • Macro Indicator: Bond Yield Spreads, etc.
      • Sentiment/Psychology
      • Technical Analysis
    • Graphic/Icon sources
    • Contact
      • Alternate Contact (mobile)
  • Blog
    • Public Posts Only
  • Testimonials
  • Substack
  • Indicator Charts
  • Links
  • Toggle website search
Press Escape to close the search panel.
Menu Close
Search this website Press Escape to close the search panel.
  • NFTRH Premium
    • Subscribe: Info & Options
    • Report Archive [pw]
    • NFTRH+ Updates [pw]
    • In-Day Notes [pw]
    • What NFTRH Is, Is Not
    • Why the Macro?
    • Fundamental vs. Technical
    • Welcome to NFTRH
    • NFTRH FAQ
  • About
    • “Hammer”
    • Content Admin & Marketing
    • Copyright
    • Terms of Service & Privacy
    • Our Tools
      • Macro Indicator: Gold-Silver Ratio (GSR)
      • Macro Indicator: T-Bond Continuum
      • Macro Indicator: Bond Yield Spreads, etc.
      • Sentiment/Psychology
      • Technical Analysis
    • Graphic/Icon sources
    • Contact
      • Alternate Contact (mobile)
  • Blog
    • Public Posts Only
  • Testimonials
  • Substack
  • Indicator Charts
  • Links
  • Toggle website search
Search this website

Blog

  1. Home>
  2. 2015>
  3. November>
  4. 6>
  5. NFTRH Interim Updates>
  6. NFTRH; S&P 500 Short-Term Status Updated

NFTRH; S&P 500 Short-Term Status Updated

  • Post author:Gary
  • Post published:November 6, 2015
  • Post category:NFTRH Interim Updates

2 days ago we reviewed a 60 min. chart of the S&P 500, for a look at what could constitute a breakdown of the rally.  Here is the same chart updated.  SPX has eased down to the lower moving average and RSI has gone below 50.  This is not yet conclusive, but it is tentative.
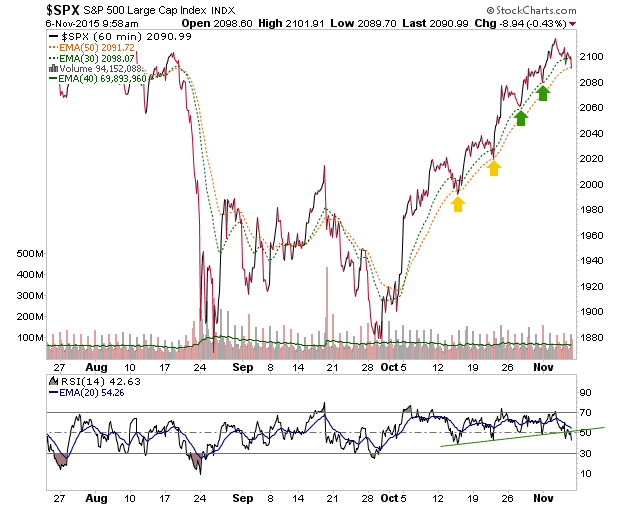
s&p 500 60 min. chart

Share this:

  • Share on X (Opens in new window) X
  • Share on Bluesky (Opens in new window) Bluesky
  • Share on LinkedIn (Opens in new window) LinkedIn
  • Share on Stocktwits (Opens in new window) Stocktwits
  • Share on Facebook (Opens in new window) Facebook
  • Share on Reddit (Opens in new window) Reddit
  • More
  • Email a link to a friend (Opens in new window) Email
  • Share on WhatsApp (Opens in new window) WhatsApp
  • Share on Tumblr (Opens in new window) Tumblr
  • Share on Telegram (Opens in new window) Telegram
  • Share on Pinterest (Opens in new window) Pinterest

Like this:

Like Loading…
Tags: SPX

Read more articles

Previous PostNFTRH; Market Update… US Stocks & Gold Stocks
Next PostNFTRH; SPX 60 min. Chart Signal (high priority)
Post author avatar

Gary

NFTRH.com
  • Facebook
  • Twitter
  • Linkedin
  • YouTube

Enter email to subscribe to all posts, public & private

© 2006-2026
%d