A snapshot of current daily technicals…
Precious Metals
GLD is just above very tentative support. Does not mean much however, until it closes above the SMA 50.

SLV is approaching key resistance and SMA 50. Bearish below it.

GDX closed above resistance yesterday. 20 area is still considered resistance, however.

SIL created and so far has held, support.

SLV vs. GLD would go in tandem with a continued sector bounce as well as potential relief in commodities. It remains below initial key resistance as it bounces.

GDX vs. GLD is bouncing as it should during a rally. This appears to be a key level to break through.

GLD-USO continues to stair step higher. This fundamental indicator asks us to consider quality miners (when the time is right) as opposed to relatively richly valued Royalty companies.

GLD-DBC is still in recovery and supportive of our big picture economic contraction thesis.

GLD vs. SPY has unsurprisingly gone nowhere and remains counter productive this week, to anyone cheering for a big near term rally or bull phase in the miners.

Commodities
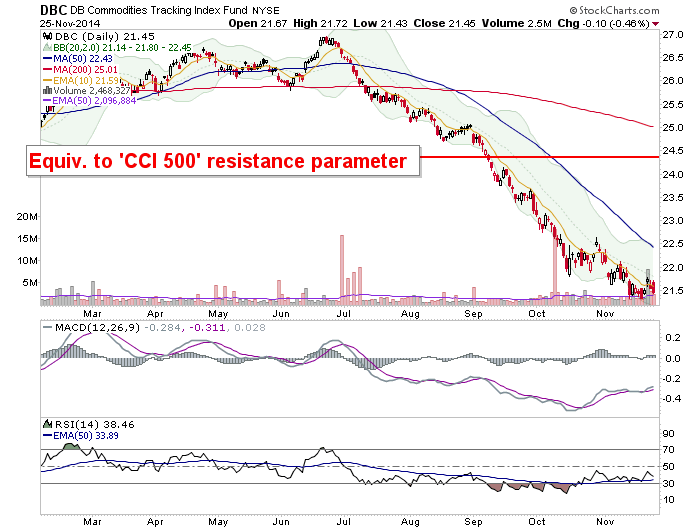
DBC did Thing 1 in sporting some positive divergence in the oscillators. Thing 2 remains elusive however, as price has yet to go anywhere. Commodities remain bearish as a whole but crude oil is really putting the stink on the whole sector.
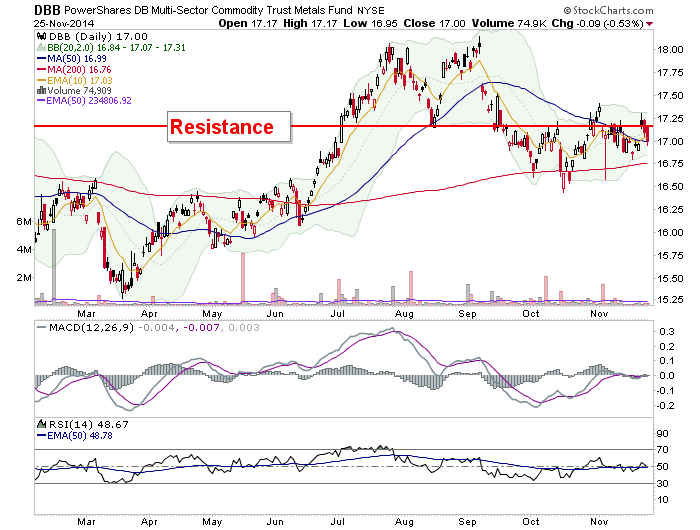
DBB is below visual resistance but at the SMA 50, so it is worth keeping an eye on.
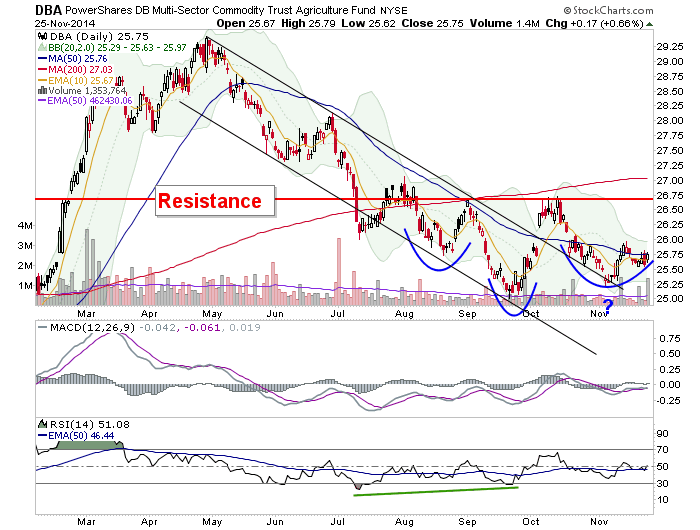
DBA still holds the potential for a bottoming pattern although I would really like to see it get above and hold the SMA 50.
USO… Do you remember all the hype about Peak Oil? How much more evidence do we need that hype is everywhere in the mass market media and investor mindset? We called it hype then (2007-2008) and wouldn’t you know 6+ years later we get headlines like ‘The World is Awash in Oil’. Keep B/S Detectors at the ready folks. Somebody’s always trying to sell you something. Oh, as to the chart… it’s bearish. Our target has been WTI Crude to 70 (currently 73.88).

UNG continues to grapple with resistance (up to the SMA 200) and support (SMA 50).

PALL is in a constructive looking pattern and above the SMA 50. Big resistance is just above, however. A break above that would target the highs. Keep an eye on this one. In fact, call it an NFTRH+ idea with a break and hold above the SMA 200 loading a target of 85. Stop loss below SMA 200 (very conservative and intolerant) or below SMA 50 (for those more risk tolerant).

URA got excited when Japan fired up a couple reactors. Now let’s see what it does at the SMA 50. Support is roughly 12 to 12.50.

COPX continues to be bearish below resistance/SMA 50. Above those, we can talk.

Bonds
TLT continues to look constructive but as yet has not gone in tandem with a market risk ‘OFF’ squall.

TIP-TLT shows an utter lack of inflation expectations, which has indeed put risk ‘OFF’ in commodities.

HYG-TLT continues to show what should be a gathering risk ‘OFF’ in the US stock market. This is an ongoing negative divergence.

Stock Markets
SPY is over bought, sponsored by unhealthy sentiment and over confidence in policy making. Yup, sounds about right for a bullish backdrop. Seasonals aside, the risk vs. reward from a contrary perspective could not be worse. Recall we did note in #318 that these unhealthy things can go along with an upside blow off scenario. The ‘Resistance exceeded’ note was added when SPY turned the expected post-corrective bounce into something more.

QQQ is pretty much the same situation.

SMH is at new recovery highs after the big over reaction. We have Intel targeted for 40, but a lot of the stuff in this sector can be viewed as suspect going forward if the Book-to-Bill continues its downtrend (ref. Semi equipment stocks).

IWM broke above resistance and made a higher high to boot. We are entering a seasonal period when Small Caps tend to perk up relative to Large Caps.

EWC got above and has held resistance (now support). The pattern measures to around 32 or so.

EZU… well don’t look now but here comes Draghi-goosed Europe. Key support is noted.

EWG is similar.

EWP represents the PIIGS and just made a higher high.

EEM would be bullish for a continued bounce if it gets above the SMA 200. Never mind the Death Cross hype in the short-term. Look at Europe.

FXI is above the moving averages and dealing with resistance. It leans bullish.

DXJ (currency hedged) is leveraging the Yen nicely. Support is noted.

Currencies
FXE bearish below resistance. FXY flat out bearish. UUP still well above initial support. Commodity Currencies (Canada and Aussie) are not shown but are bearish on the big picture, with Aussie looking bad on the daily as well.


Bottom Line
Precious Metals: Bouncing but still at or below key resistance levels.
Commodities: Still bearish on balance but some items are in bounce patterns.
Stock Markets: US is bullish, over bought, unhealthy. Question remains, will it blow off or correct its excesses in the near-term?
Global features a bouncing Canada (it’s real stock market anyway, not talking about the TSX-v) Europe making a strong move per Draghi. Japan is mirroring its currency and EM’s and China 25 are constructive for continued bounce.