

US Stock Market: Bounced as expected, pulled back into FOMC, bounced again. Now back to decision points generally where resistance meets the 50 day averages. Technicals will guide.
US Market Sentiment: Biased to contrary bearish as casino patrons breathe collective sigh of relief on supposed Goldilocks payrolls number.
Market Indicators: Real-time market stress indicators like High Yield spreads, Libor/T-bill and VIX back to sleep. Implies two things: bullish backdrop and high risk. Longer-term risk indicators like 2yr yield divergence to T-bill yield, yield curves and imply oncoming bear market. But they are in process, not realized.
Global Markets: Last week >>> Global (ex-US) bouncing to test the SMA 50, much like the US. Contrary play China large caps leading US large caps for most of 2024, but still in a downtrend. Generally, the world is bouncing back from a hard downturn. Current >>> Global, ex-US takes out the SMA 50 while US ponders. If it is leading, US may follow. Global benefited from the weak USD. If USD holds its rally, story could be much different. Segment summarizes individual markets.
Precious Metals: Volatility within a mushy consolidation after the short-term Diamond pattern (GDX) played out to the downside, but did not crack initial support. Still targeting 40 (+/-) with the possibility of deeper correction first. Regardless, gold and silver are bullish and highly constructive, respectively, while still in corrective mode, short-term. The miners see improving fundamental by the Gold/Oil ratio, not a small thing. But the macro has not yet turned for the masses to see, so the sector is not yet unique.
Commodities: It’s the traditional game of Commodity Whack-a-Mole, as one pops, gets smacked, and another pops. The report below tracks the signals for the ‘inflation trades’, including signals from the TSX-V index.
Currencies: USD took a hard hit but held support on Goldilocks Friday. In Wonderland, signs of economic weakness imply weak Fed imply weak dollar imply strong asset markets. In reality, a potential bid for USD could come from a market liquidity event. We’ll continue to watch the Gold/Silver ratio for signs of that.
In the Aftermath of FOMC & Payrolls
From last week’s Summary segment on SPX:
Last week: Anticipated correction is here. There could be a short-term bounce to test 50 day averages, but correction likely has lower to go. Segment illustrates SPX targets. Current: Decision time about a new ‘C’ leg down or ‘minor correction over’… technicals will be the guide in the short-term.
The bounce to test the SMA 50 came about, SPX then dutifully dropped into FOMC and then bounced on the weaker Payrolls number. However, the technical situation has not changed. You see, when even the officially massaged jobs number cannot hold serve the popular conclusion is that the Fed will pivot dovish and rate cuts will come sooner, not later. Two problems with this line of thinking: 1) it is when rates start to fall that bear markets tend to begin, not during rate hike regimes and 2) when even the officially managed employment numbers look bad you know the economy is corroding beneath the surface. Ultimately, the stock market reflects the economy, eh?
However, it is obvious that market participants, relieved of hawkish Fed/inflation fears, chose to see Goldilocks in the Payrolls report. To each her own, I guess.
The daily chart shows a short uptrend channel that will either resolve as a bear flag or cause me to cover my short, not being a stout or committed bear and all. This pig never did even pull a 38% Fib retrace on the pullback and is compromising the A-B-C correction view by ticking above the previous high. What’s more, the looks of RSI and MACD look sneaky to the bull side. So if indeed, it is ‘party on’ on Fed relief, so be it. Meanwhile, SPX still resides at the SMA 50 and resistance, so I am not giving up the short position yet.
If it does resume the bear, the best target is where the SMA 200 is rising into a support shelf in the 4700 to 4800 region. That would also register a 38% and/or 50% Fib retrace.

NDX is very similar. The index is right at the point where someone who wants to short would short (it’s a short setup). NDX and SPX each have clear tolerance points above the SMA 50, and the other edge of that sword is that they are also on the verge of ending the correction and busting bullish.

SOX is right there as well.

So over the last two weeks we projected a potential bounce, which came about, where I personally shorted at those short setups (against a few long positions held). Then the indexes obediently dropped into FOMC and on Friday rammed upward on the great news of an unexpectedly weak Payrolls report. Yeah, sounds about right.
You may have noted Friday’s gaps upward on the charts. They can fill promptly or they can fill later, perhaps after the next bear begins. But if the indexes start to think about filling them next week I would also prepare for the potential of a ‘sell the news’ (of dovish Fed) resumption of the correction.
As per last week, the technicals will guide as opposed to the convoluted macro (weak jobs, celebratory stock market) or the sentiment backdrop.
US Market Sentiment
As for sentiment, short-term risk jerked upward with the little post-jobs gap up joy fest on Friday and medium-term risk is elevated. Hardly a contrary bullish picture. Dumb money began eating the Fed relief. The picture is not positive for the bullish case. It will become even less positive on a risk/reward basis if the markets break upward. Otherwise, a resumed correction would likely drive sentiment down to a contrary buy area in the coming weeks/months.
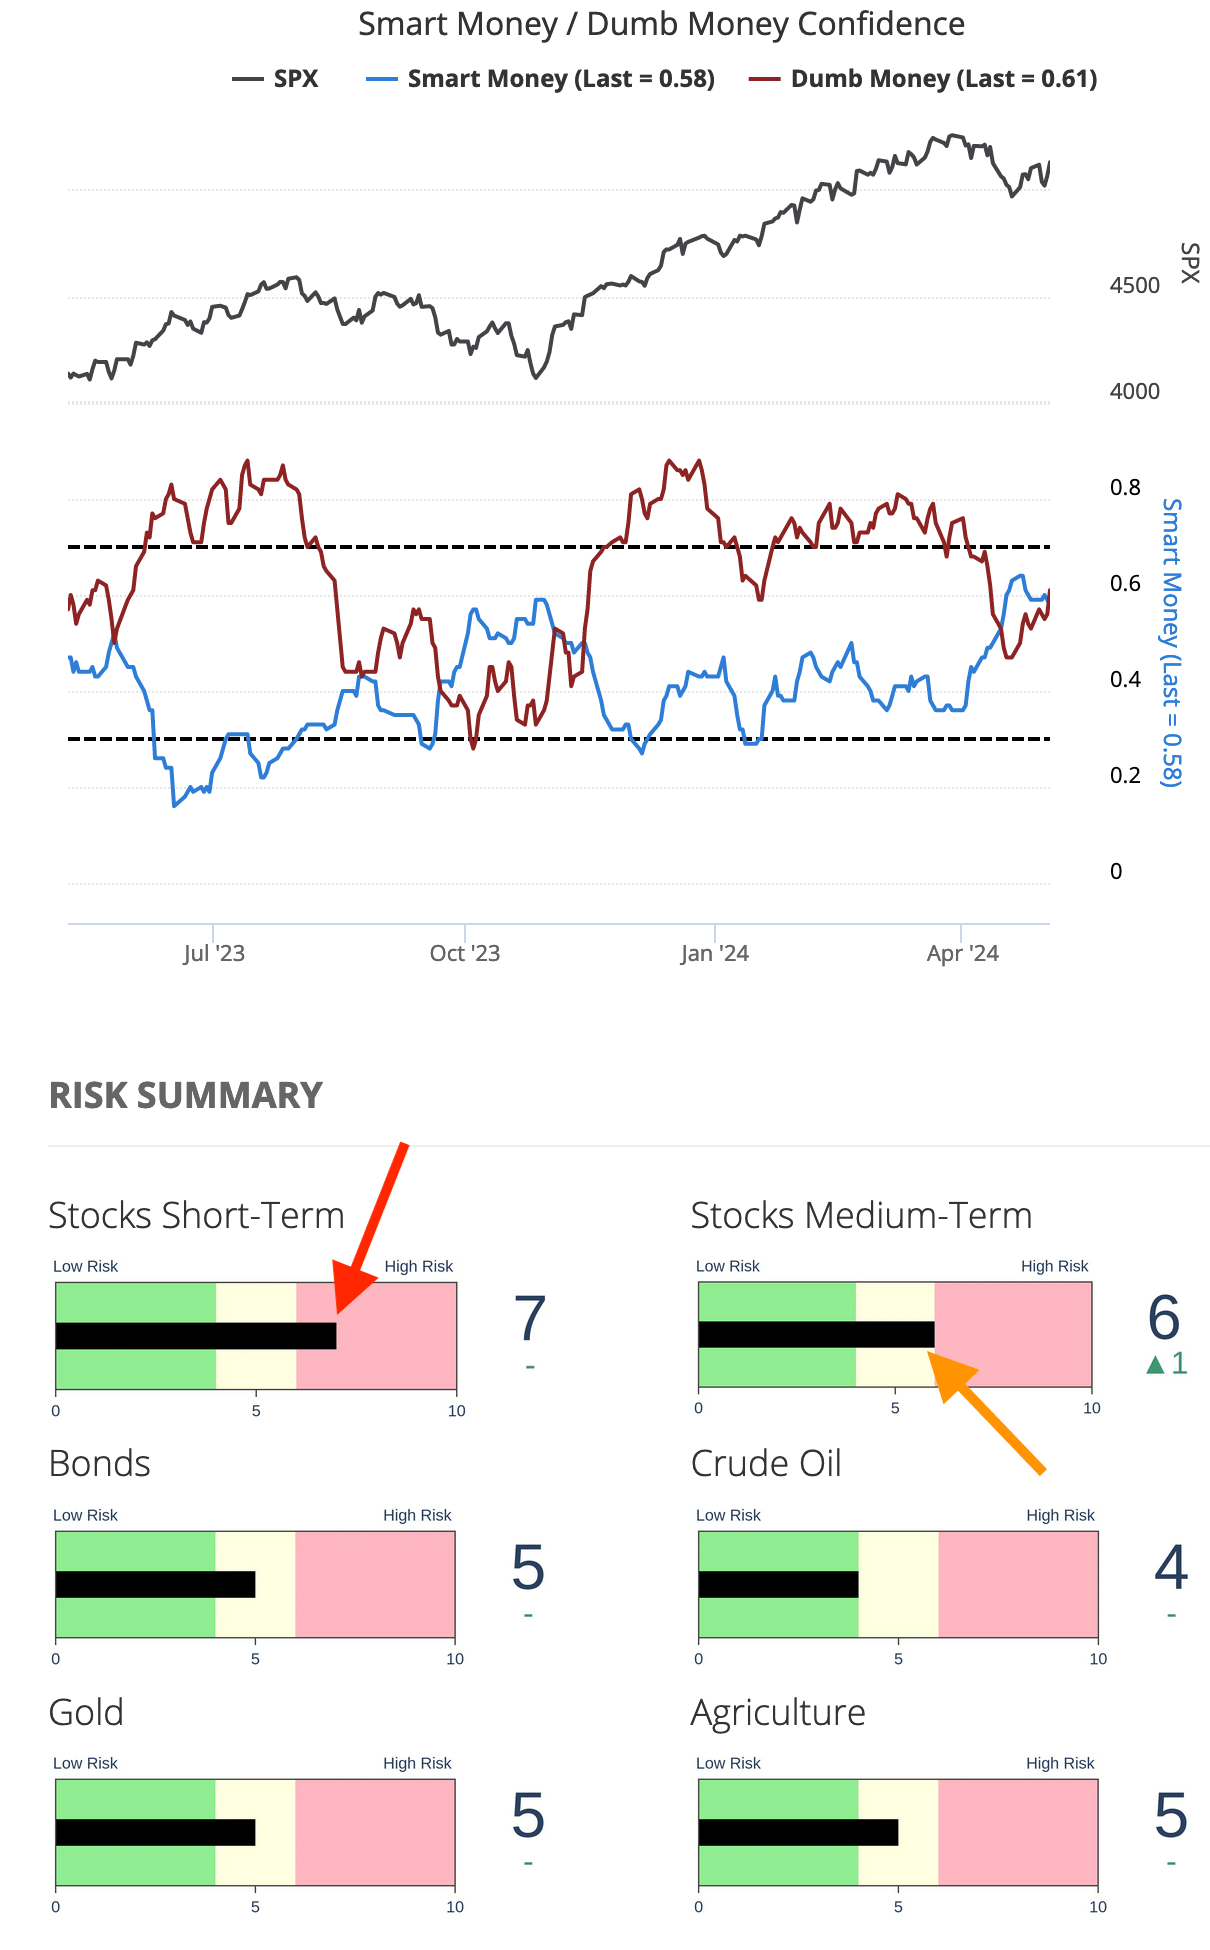
- Investors Intelligence (newsletter bulls/bears) was last read on April 23 (per NFTRH 807) and had pulled back hard to a contrarian market bounce potential. That came about. II tends to be a little more sticky than flitty stuff like the above or NAAIM and AAII.
- NAAIM (investment managers) was in a sharp pullback, sentiment-wise, into FOMC at 62% bullish. This was not extreme, but was permissive of the bounce that then came about.
- AAII (Ma & Pa) had pulled back hard into May 2, on Fed/inflation anxiety. The Bull/Bear ratio declined to 1.2 which, while not over-bearish to a major extreme, was bearish enough to be a prerequisite to a market bounce. It was a perfect bounce indicator, contrary-wise.
Market Sentiment Bottom Line
Middle ground with a bias toward contrary bearish. We do not have the II, NAAIM or AAII readings as of the weekly close, but dollars to donuts they started eating the market by week’s end.
Market Indicators
Let’s take a different tack to market indicators this week and use gold’s relationships as a macro guide as opposed to a precious metals-centric guide. The daily chart view shows a positive underpinning for gold mining sector fundamentals by the Gold/Oil ratio but less clear macro pictures by Gold/Silver and Gold/Copper. Those two will be important cyclical ‘inflation trade’ signalers. If they break upward, commodities and other markets typically thought of as inflation trades should come under pressure. If they break down well, party on Garth.
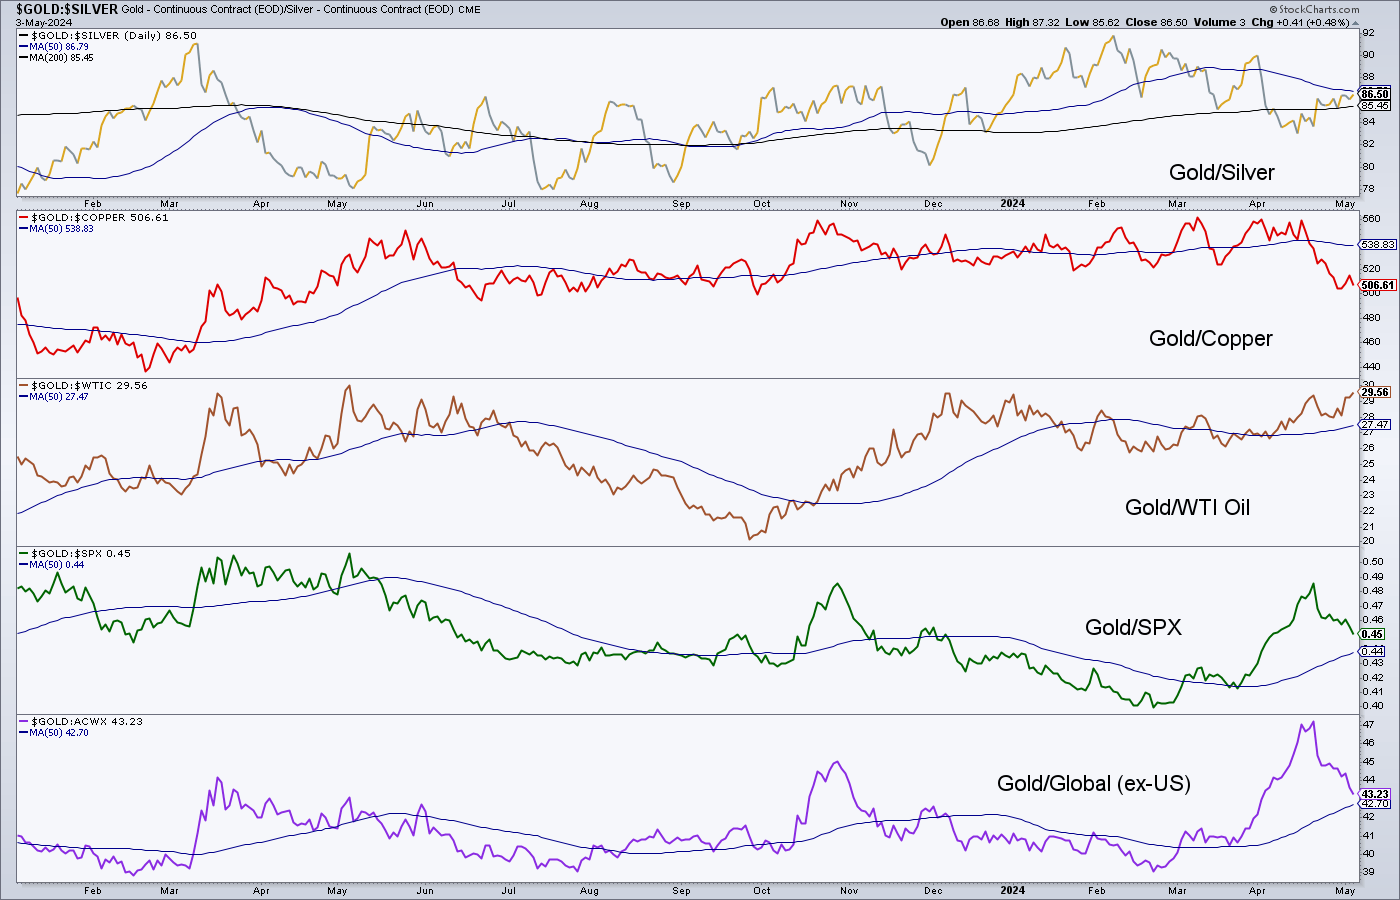
The longer-term (weekly) chart shows a mostly sideways situation telling us “no wonder” the macro has thus far refused to show its cards. However, the cards will be shown and that showing will start on daily charts like the one above. When gold rises vs. stock markets we will be firmly in the new macro with a critical mass of market participants acknowledging it. I believe we are in that macro now with the important distinction that the herds don’t know it yet.
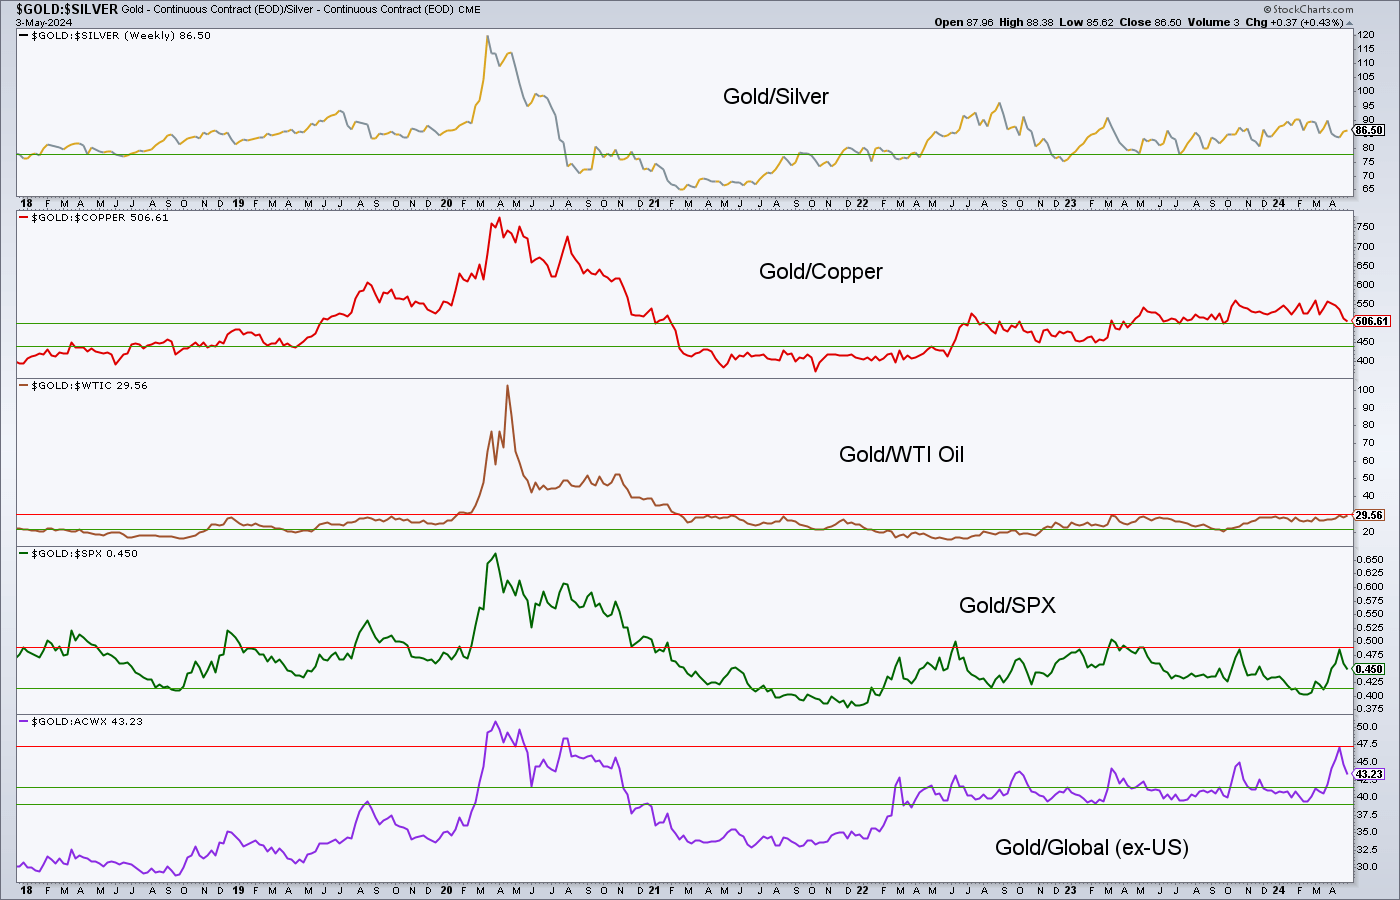
If gold also rises vs. silver, copper and commodities in general, the new macro will be indicated to be deflationary (before any talk of a new or resumed inflation phase). If gold fails vs. those items the next macro phase would likely be inflationary. As yet, the market holds its cards close to the vest and so shall I hold my personal strategies close to the vest until I get clear readings.
As a companion to the Gold/Silver and Gold/Copper ratios, we can also watch the Canadian TSX-V index, which is intact to its rally from Q4, 2023. Our main target was resistance at 595, which has been registered. But the gap at 622 is still yawning as another possible upside objective.

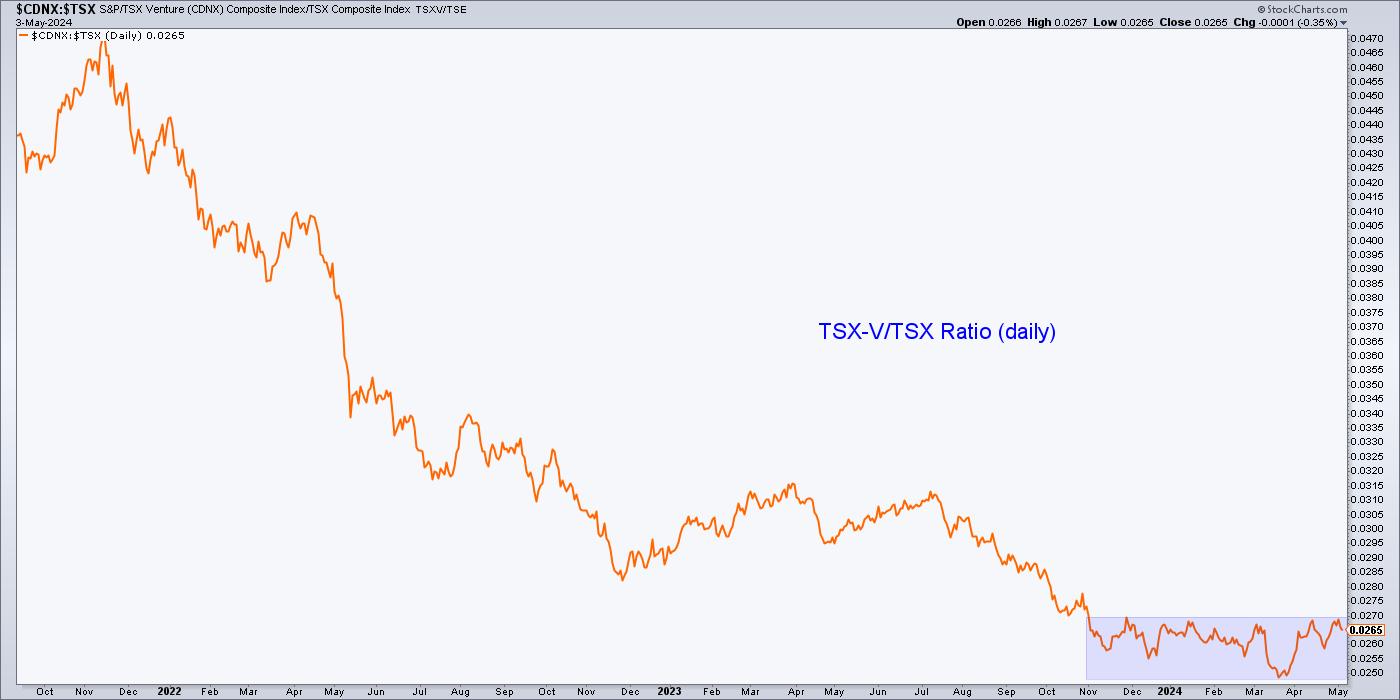
Long-term subscribers may remember that we used to use the TSX-V/TSX ratio as a guide to the inflation trades and in particular, commodities. Over time this indicator of market participants’ willingness to speculate in the commodity sectors has preceded or gone hand in hand with commodity indexes. Most recently the ratio did pop along with commodities as the inflation manufactured by central banks in 2020 evolved into an inflation trade.
The ratio soon topped out and has since made new lows while commodities corrected but have not nearly corrected to the degree of their sometimes partner. But you will note that negative divergences in 2006-2008 and 2011-2014 did precede serious commodity corrections. But on this slow moving monthly chart, such things take can take months, even years to play out. Currently TSX-V/TSX forecasts bad things for commodities, which is why it will be important to keep an eye on the nominal TSX-V above for the duration of its rally. If it should morph bullish (fill the gap and make a new high to the 2023 high) players would start to froth and swing back in.

Dialing in to the daily chart view of TSX-V/TSX, this sideways consolidation will be telling. Consider the ratio back in rotation now as we seek to either confirm or negate a real inflation trade, like the “super cycle” that commodity perma-bulls have been insisting is coming for the last however many years. Break that consolidation and just maybe the commodity “super cycle” squirrel finds his nut.
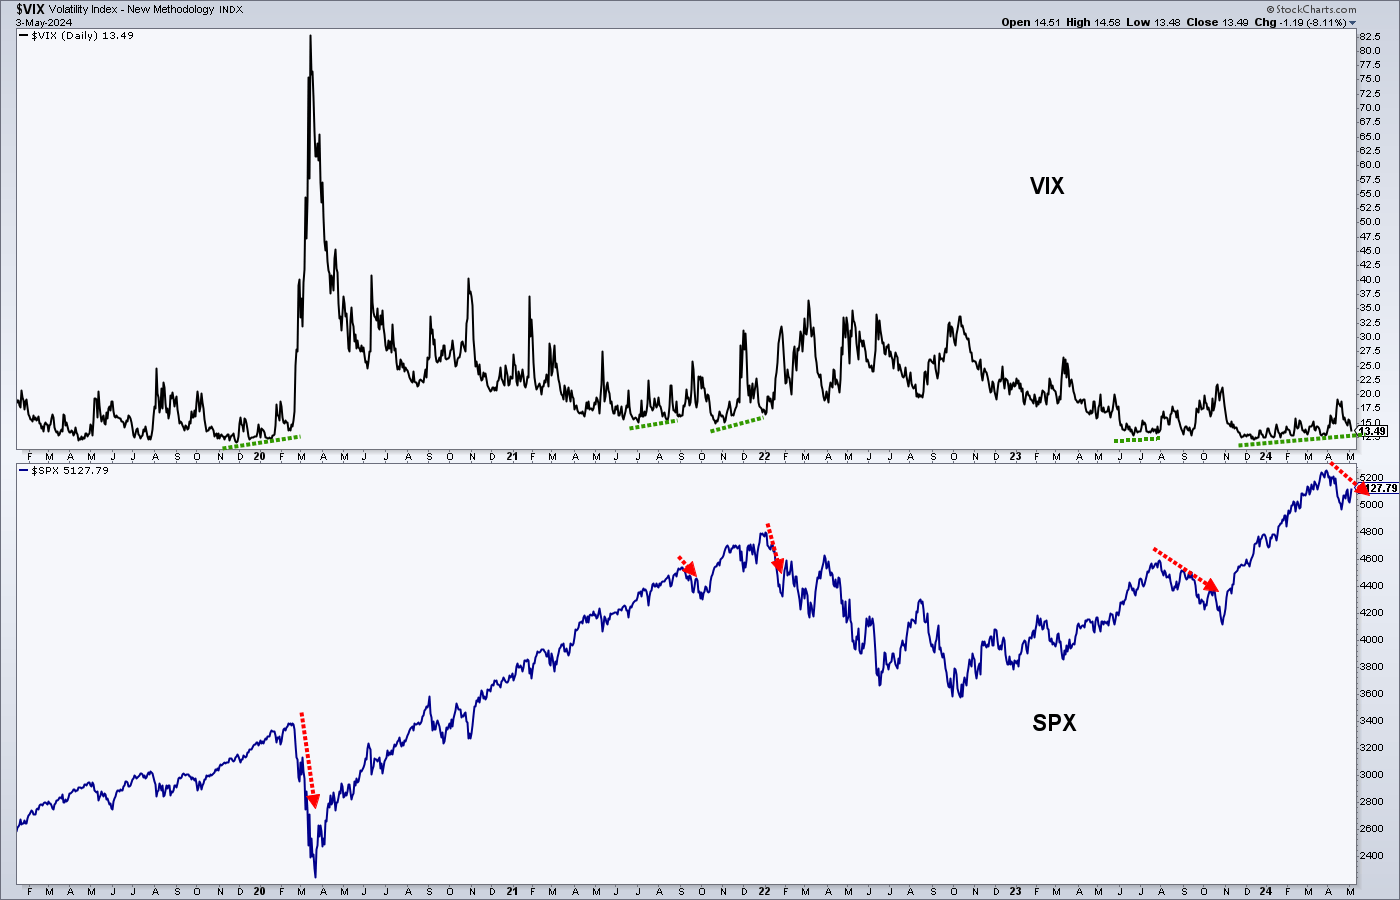
On to more traditional indicators for the US markets, let’s note that the VIX is back to sleep (who’s surprised?) but indicative of building risk. I realize VIX is not a stock or an index but its gap up was indicative of a knee jerk toward fear and the relief currently in play is closing out that anxiety. VIX can wallow interminably, so it is not necessarily an indicator of imminent risk realization.

VIX does retain the divergence to SPX that helped us see the thus far moderate stock market pullback well ahead of time. In other words, if the pullback is going to morph into a deeper correction this divergence is still there saying “go for it”.
- High Yield Spreads are back on the floor indicating little market stress.
- Libor/T-bill yield spread is on a similar message of calm.
- Sticky Consumer Price Index (less food & energy) as measured by the St. Louis Fed, has been declining since a high or 6.52 in 2022 to the current 4.50. The decline has been uniform, with no bounces in these prices. It is contrary to the recent uproar about renewed inflation.
- Real 5 & 10yr Treasury Yields are elevated (10yr at 2.22 vs. 1.71 in January) with the recent bond market reaction to the bump up in other inflation signals. This should fade again if the bond market recovers and these inflation signals fade (joining ‘sticky’).
- 2yr Treasury yield continues to negatively diverge the Fed Funds proxy T-bill yield even though yields of all durations rose sharply of late. This is a forward bear market indicator still in place. But it’s a slow mover.
- S&P 500 Advance/Decline line is right in line with the index price. No negative divergence.
- Dow Theory shows a negative divergence by the Dow Transports to the DJIA, if anyone still cares about this old fashioned indicator. If you’ve been with NFTRH for a while, you know why Clark is forlorn. Celebratory Clark has that winning smile and a puffed up ascot when Dow Theory is on a bull signal. This is not celebratory Clark.

Global Stock Markets
With the US Payrolls report weak, implying a weakening Fed, implying a weakening US dollar, the global ETF (ex-US) popped back above its 50 day moving average.
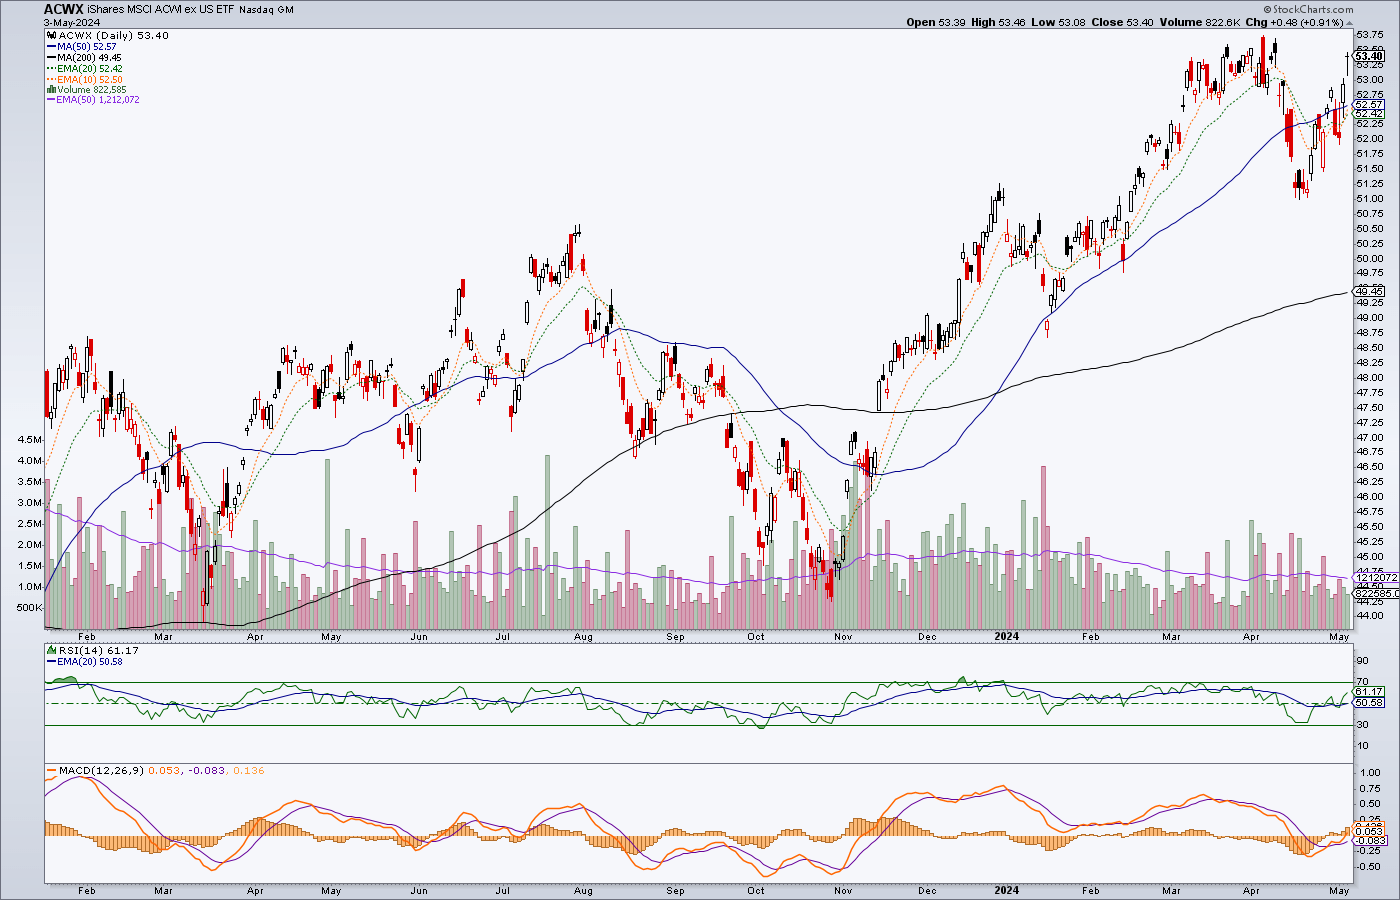
Here is what it looks like in relation to the US market (SPY). Global markets were not as stretched as US markets and they did not have as much work to do to re-take the 50 day average, on balance (above).

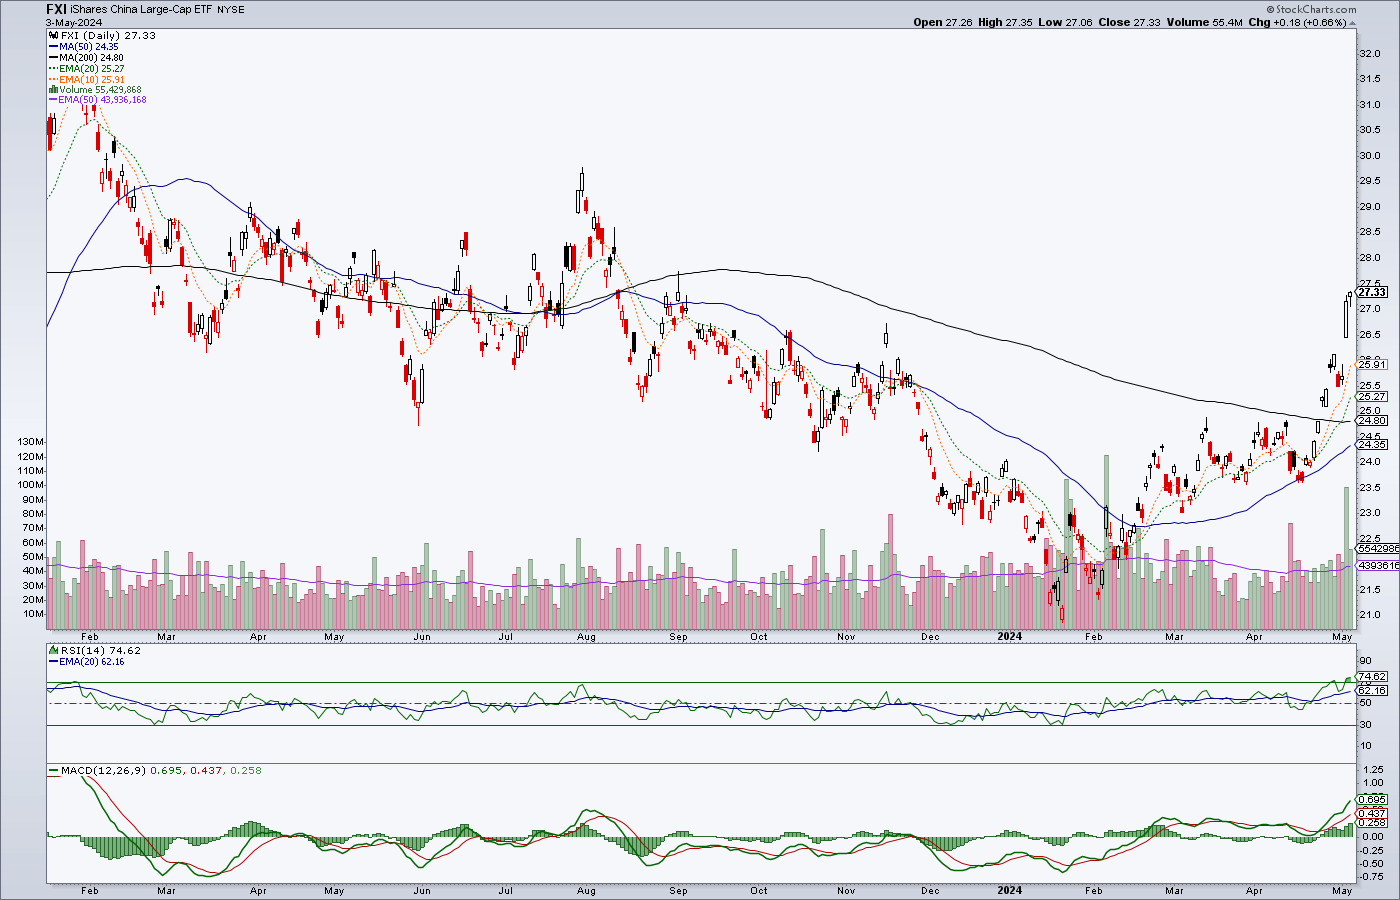
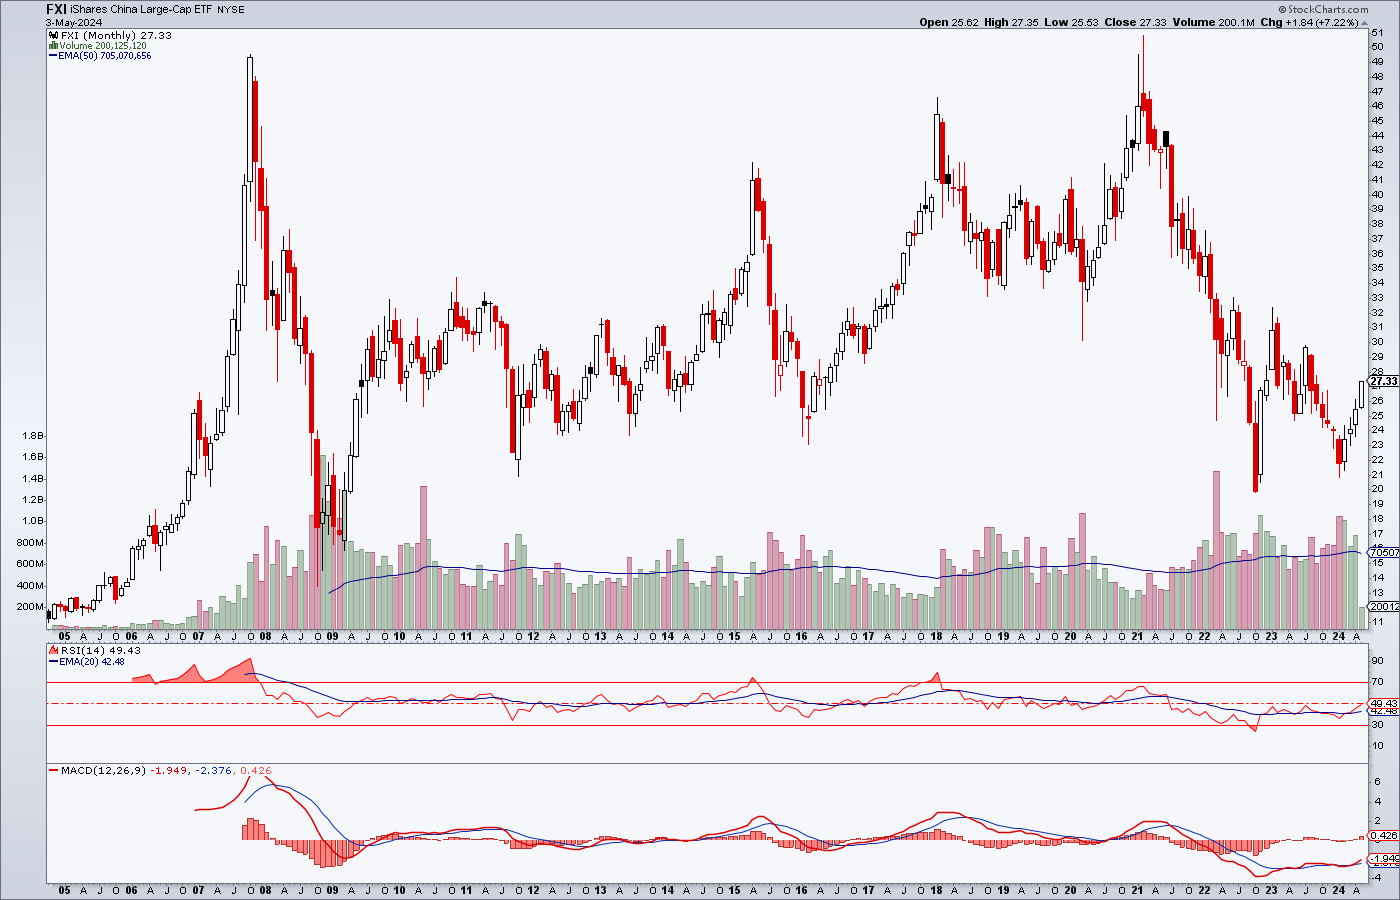
China large caps continued to bounce after we ID’d the play well in advance (and I failed to really capitalize on it). That is okay because I do not yet have conviction that it is more than an interim rotation, as previously anticipated.
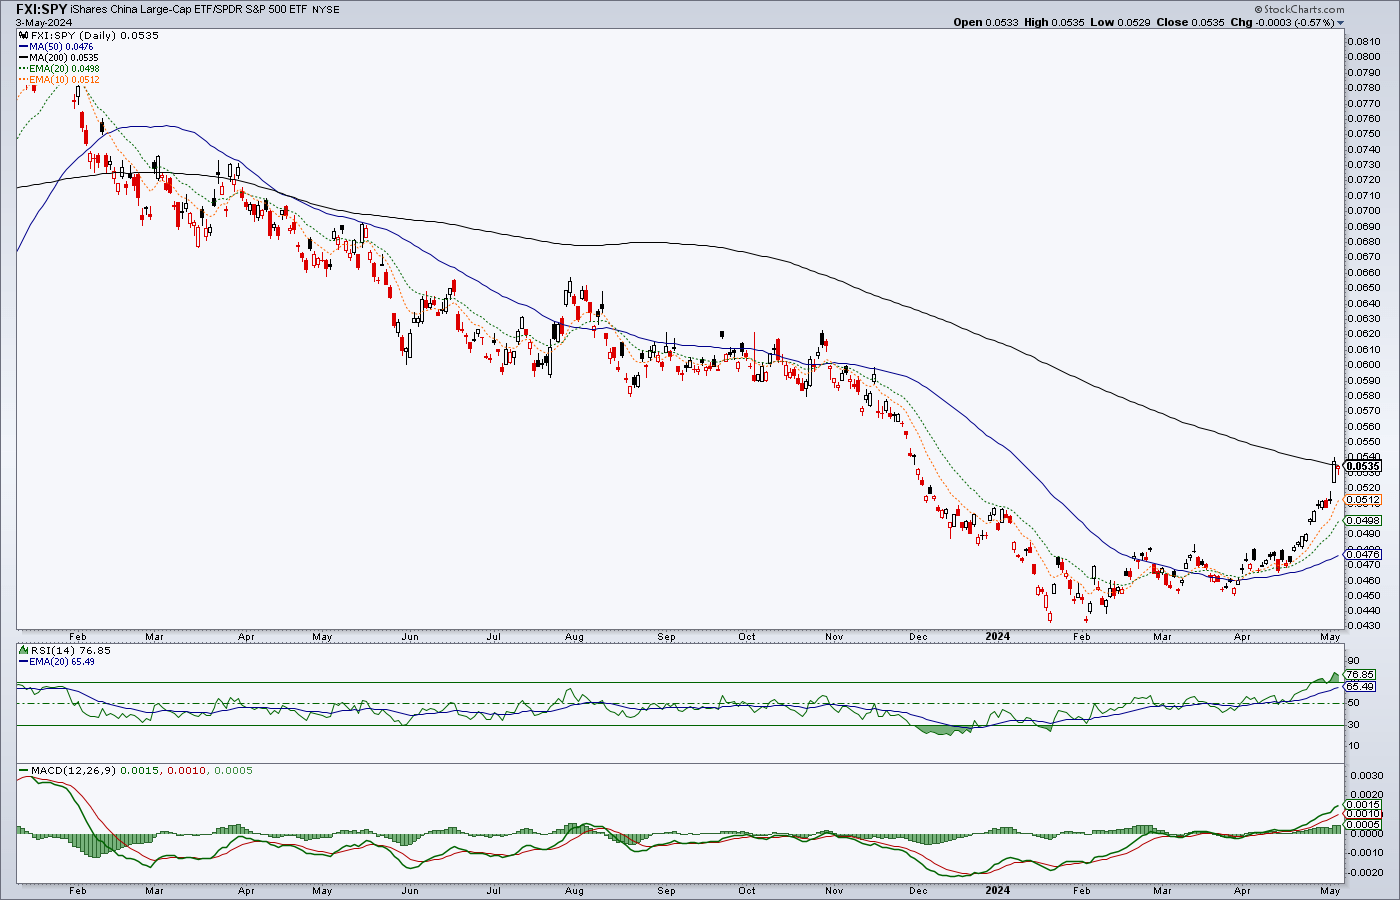
Nominal FXI is getting overbought on the daily view.
If one chooses to be an investor in a renewed ‘China story’ there will be plenty of time to do so says the monthly chart. The ‘W’ and the looks of RSI and MACD say it could happen. A rise above the last high at 29.77 could set an uptrend with some legs to it. Meanwhile, I will personally wait for it to settle down or pull back on shorter time frames.
- Europe STOXX 600: Sitting atop its 50 day average in a bull trend.
- UK 100: We noted that it was the most buyable index as it had lagged but sported a good looking pattern. It has since broken to blue sky, is bullish, but also getting somewhat overbought.
- Canada TSX & TSX-V: The senior index is halted at the point where it could break to blue sky. This resources rich country logically started out-performing the US S&P 500 as inflation started lifting commodity stocks in Energy, Metals and other areas. The ratio has pulled back in the last couple of weeks. If inflation signals fade, I’d expect TSX to also fade, at least in relation to the US. If not, then it all goes the other way. Status of the speculative TSX-V noted in the Indicators segment above.
- Australia AORD: Very similar to fellow commodity/resources-heavy market Canada.
- Japanese Nikkei: Dropped of late to relieve short-term overbought. I want lower to consider Japanese stocks. Although NTDOY is on watch for its current test of the daily SMA 200 after a sharp decline.
- Brazil & LatAm: Brazil appears to have begun a new daily chart downtrend, although the LatAm 40 is still constructive. Tough call here. But for now I’ll stick with what I understand better.
- Asia (ex-Japan)/EM: Each following China large caps and A-shares in a bullish move. Thus, each are on watch, much like China.
Precious Metals
GDX daily has become something of a mess as it consolidates and works off the overbought reading by RSI and distance from the SMA 50 (blue). It has not quite retraced even to a Fib 38% but it has thus far successfully tested the first clear support area. The longer this goes on, the better the potential that a grinding consolidation would end the correction rather than a more dramatic pullback (e.g. the gap at the 50% Fib, test of clear support, the 62% Fib and SMA 200) in the mid-26 area. Nor has GDX made a move to break the consolidation upward either.

The chart above shows the next objective, which is the sub-40 gap. The trendline corresponds with the upper line of the HUI downtrend channel we’ve been tracking (monthly chart below). ‘How can GDX hit the gap and not breakout from the trendline?’ asked a subscriber. Well, it can’t. But it’s the gold sector and what could happen – if the target is a good one – is that a heaping helping of enthusiasm could break it above the trendline, fill the gap and reverse it back down. Certainly not a prediction. But I’ve seen that movie before.
Here is the trend channel on the monthly HUI chart. You can actually see the upside tails that monthly candles tend to put in when they top out and reverse. So if it plays out to plan, it would be something like that. A breakout that gets bull horned for the troops (as GDX above fills the gap) and then reverses in-month, putting an upside tale on the monthly candle. But again, that is just gut speculation right now.
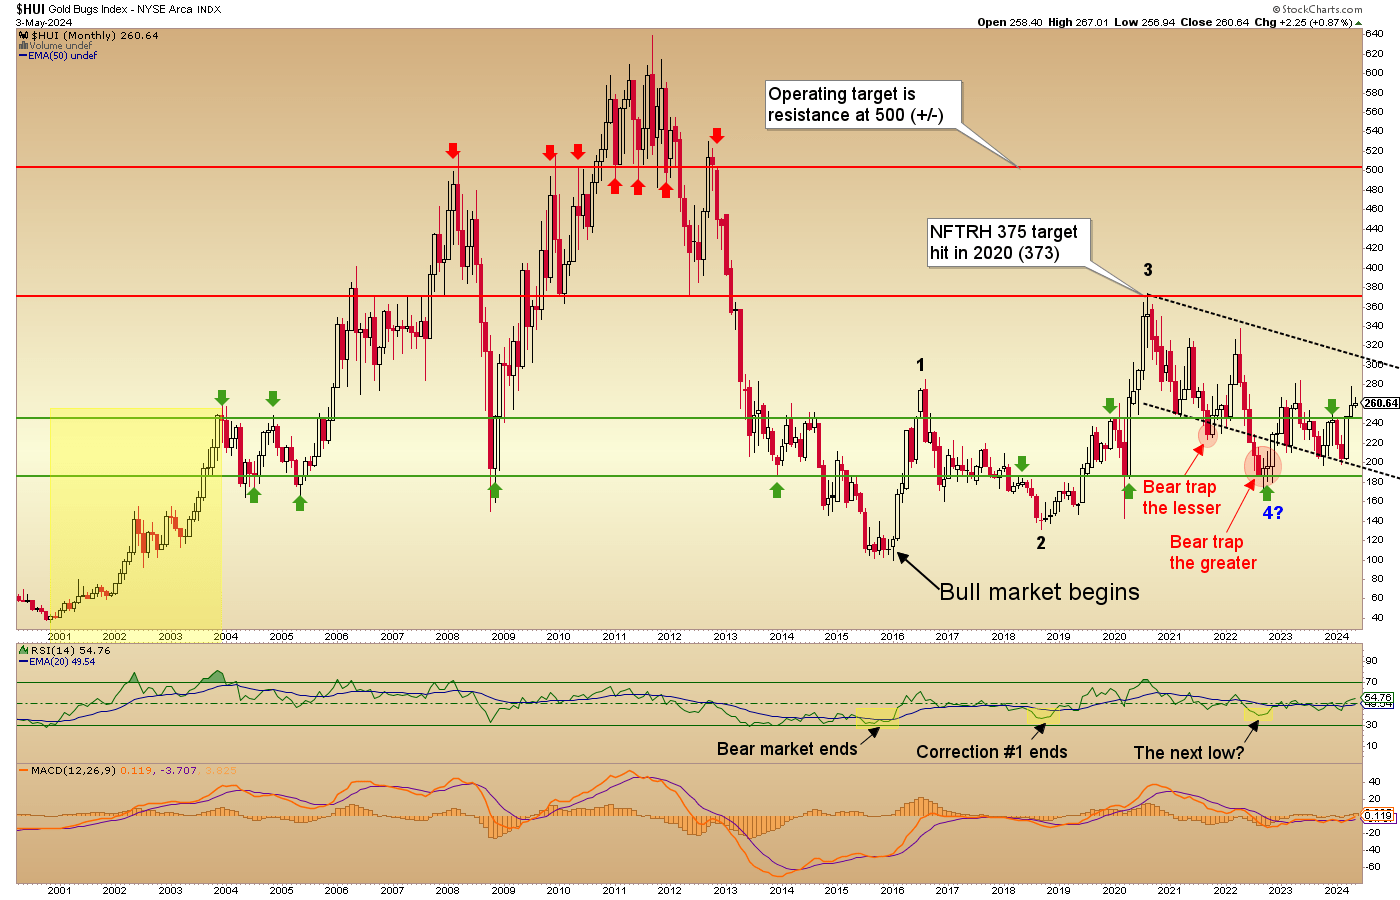
The bigger view for HUI is that this is an interminable but bullish consolidation to a bull market that began in 2016. The 240 area is now important support and RSI and MACD are coiled and ready to bull. But… monthly chart = patience because it is an oh so slow mover.
Moving on, gold (weekly) has begun pulling back from overbought. The technical implication is that the pullback can continue. But gold has busted into its new bull macro, so we should be aware that the honest money anchor has the potential to leave the station as well. But technically, let’s be aware of the pullback target shaded green, which coincides with the EMA 20 (2187). A major support test, which I do not expect, would be in the 2050 to 2100 range. Amazing that now a severe correction in gold would keep it sporting a 2-handle. It would also likely be a table pounding buy if that massive lateral support area were to be tested.

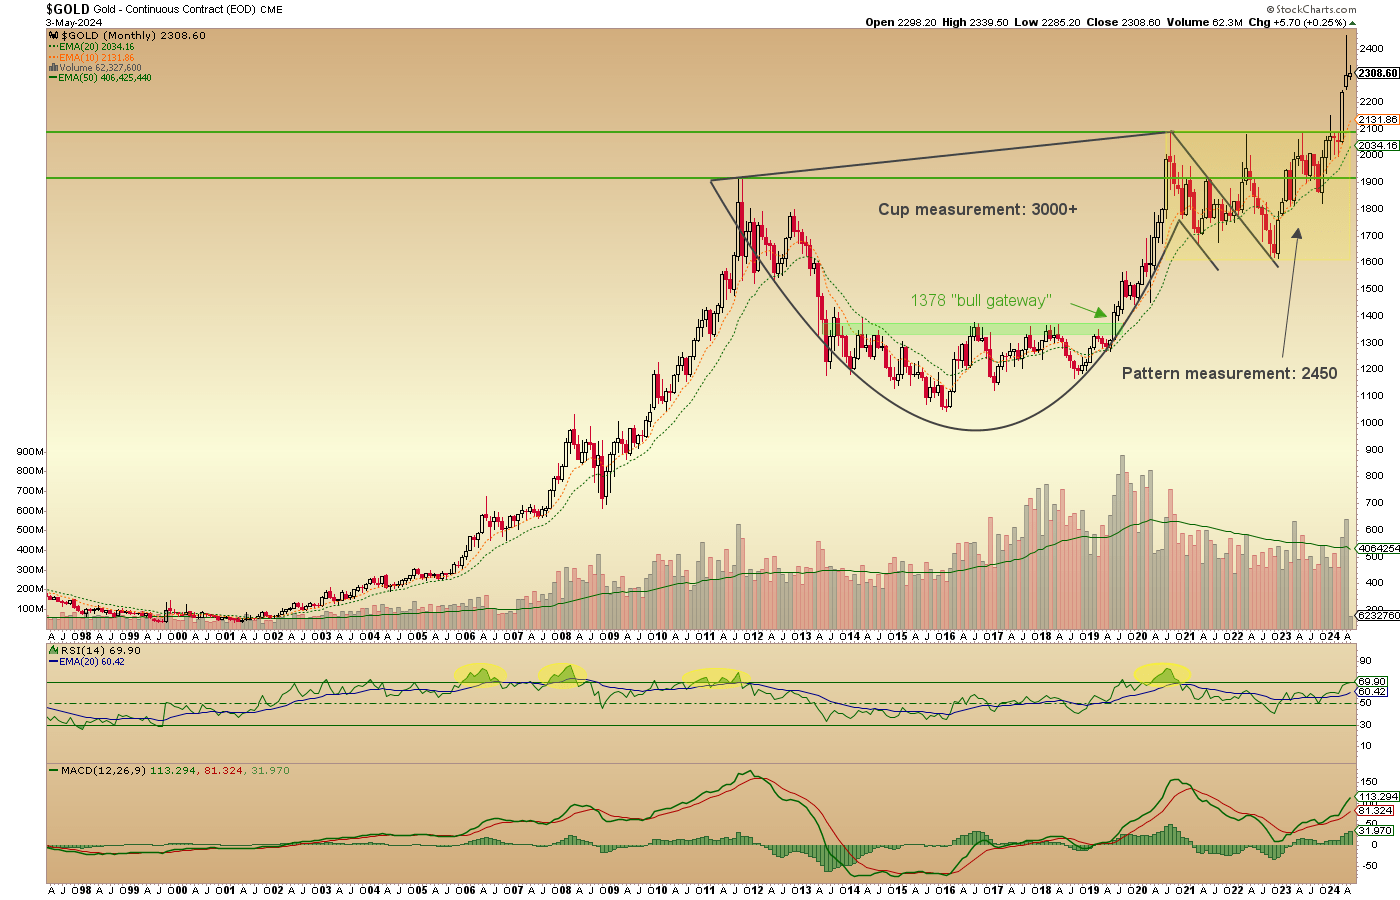
Gold’s monthly chart is provided once again because I enjoy looking at beautiful pictures. Gold in essence came to the initial target before logically reversing downward. Any continued corrective activity would add fuel for a future drive to 3000.
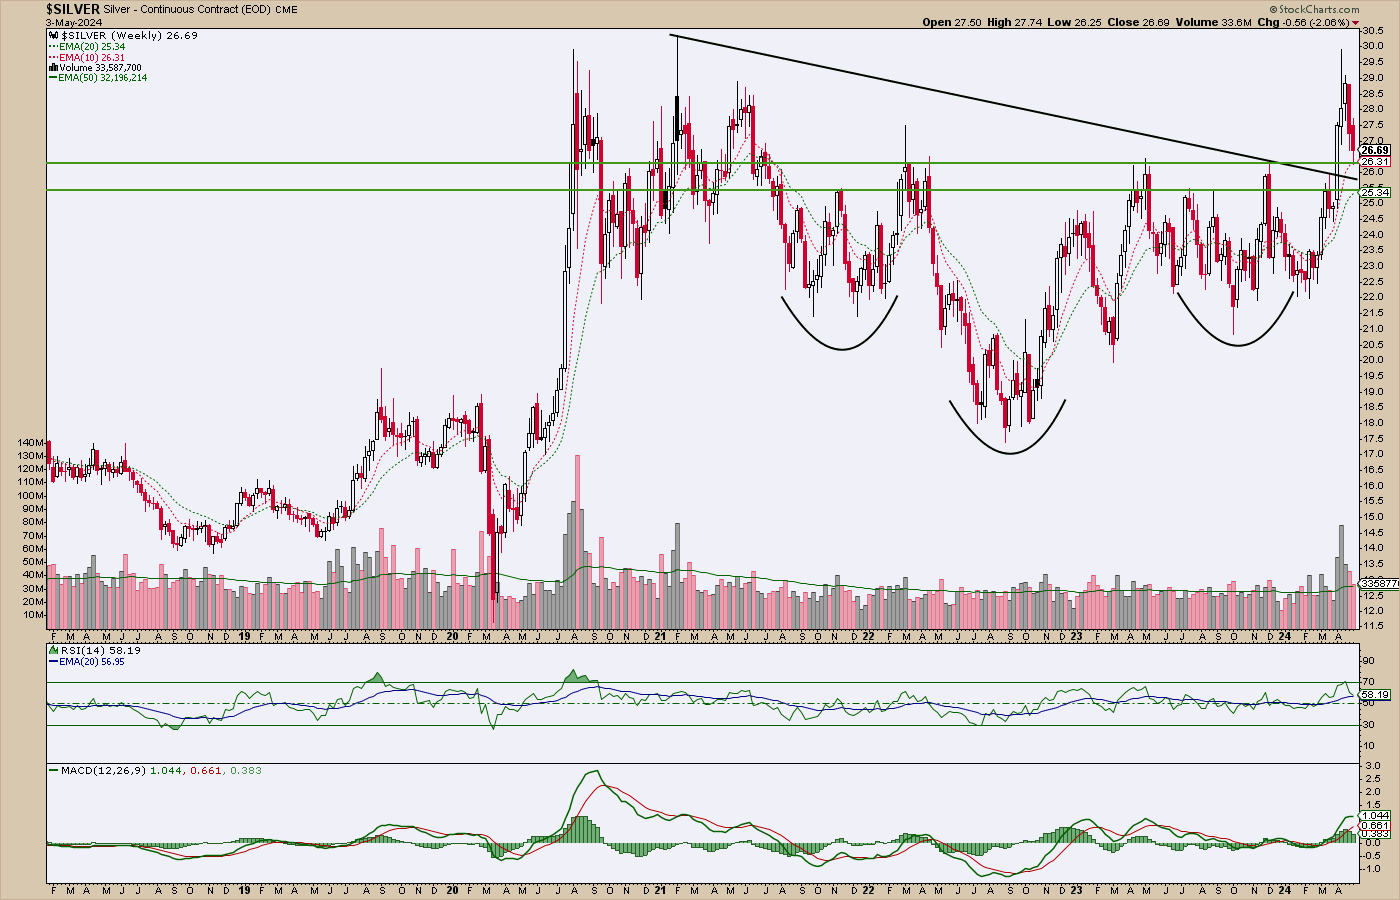
Silver (weekly) actually tempted me to re-start a position in SLV. But I opted for patience. Also, I had a very busy week outside of the markets. But at face value this is a technical buying opportunity shaping up and silver bulls probably would have wanted to take an initial position on last week’s continued drop. I will look to position as well.
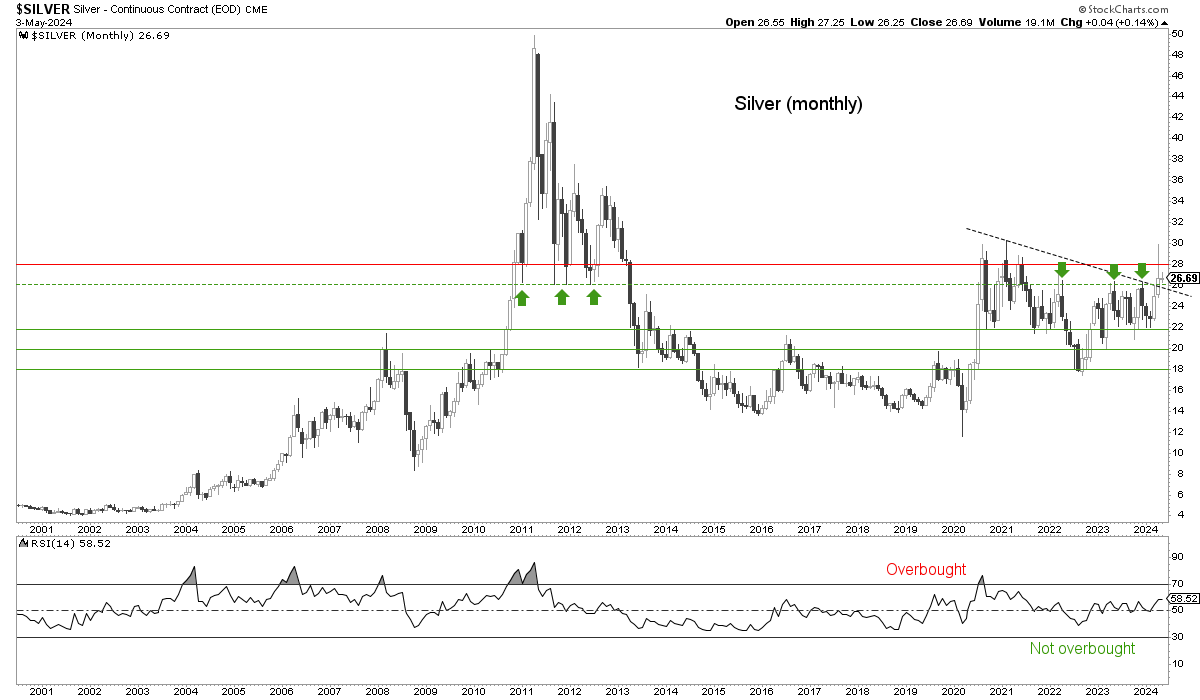
Silver’s monthly big picture chart shows that the metal halted and reversed where it has done so three times previously. All normal and to be expected. Sideways/positive RSI is coiled and the picture looks like only a matter of time. As a side note on silver, I’ll probably once again favor SLV as a price play over the miners, although I do have HL and SILV on watch as well.
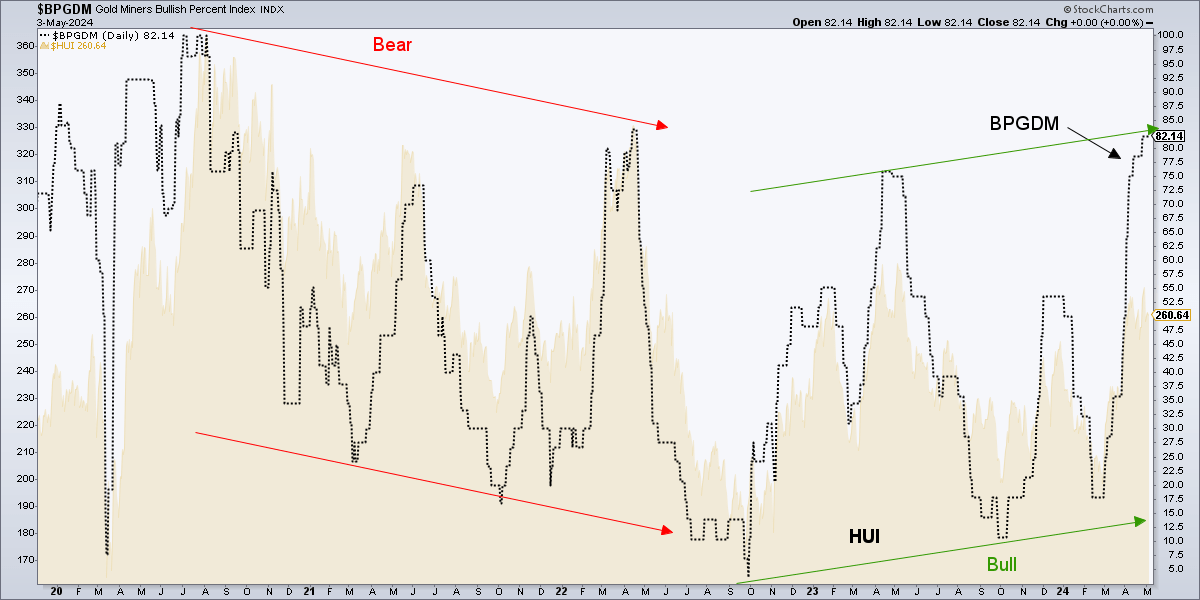
BPGDM continues to flash ‘overbought’ for gold stocks. But the monthly EMA 20 continues to look like it is bottoming with the indicator entering a new uptrend. Hence, ‘overbought’ is a sign of strength that despite volatility should put a bid under the sector that it does not have when the trend is down.

The daily chart says “I don’t need no stinkin’ EMA 20 to show that I am in a new uptrend”. I agree with you, daily chart.
HUI/Gold ratio begs your letter writer not to be overconfident about his DUST hedge position as long as it remains elevated above the 200 day moving average. The trend is still down, but if the HGR were to take out the December high, we would have a new trend signal. Either way, HGR certainly has not broken down from the 2 month long recovery it’s got going.

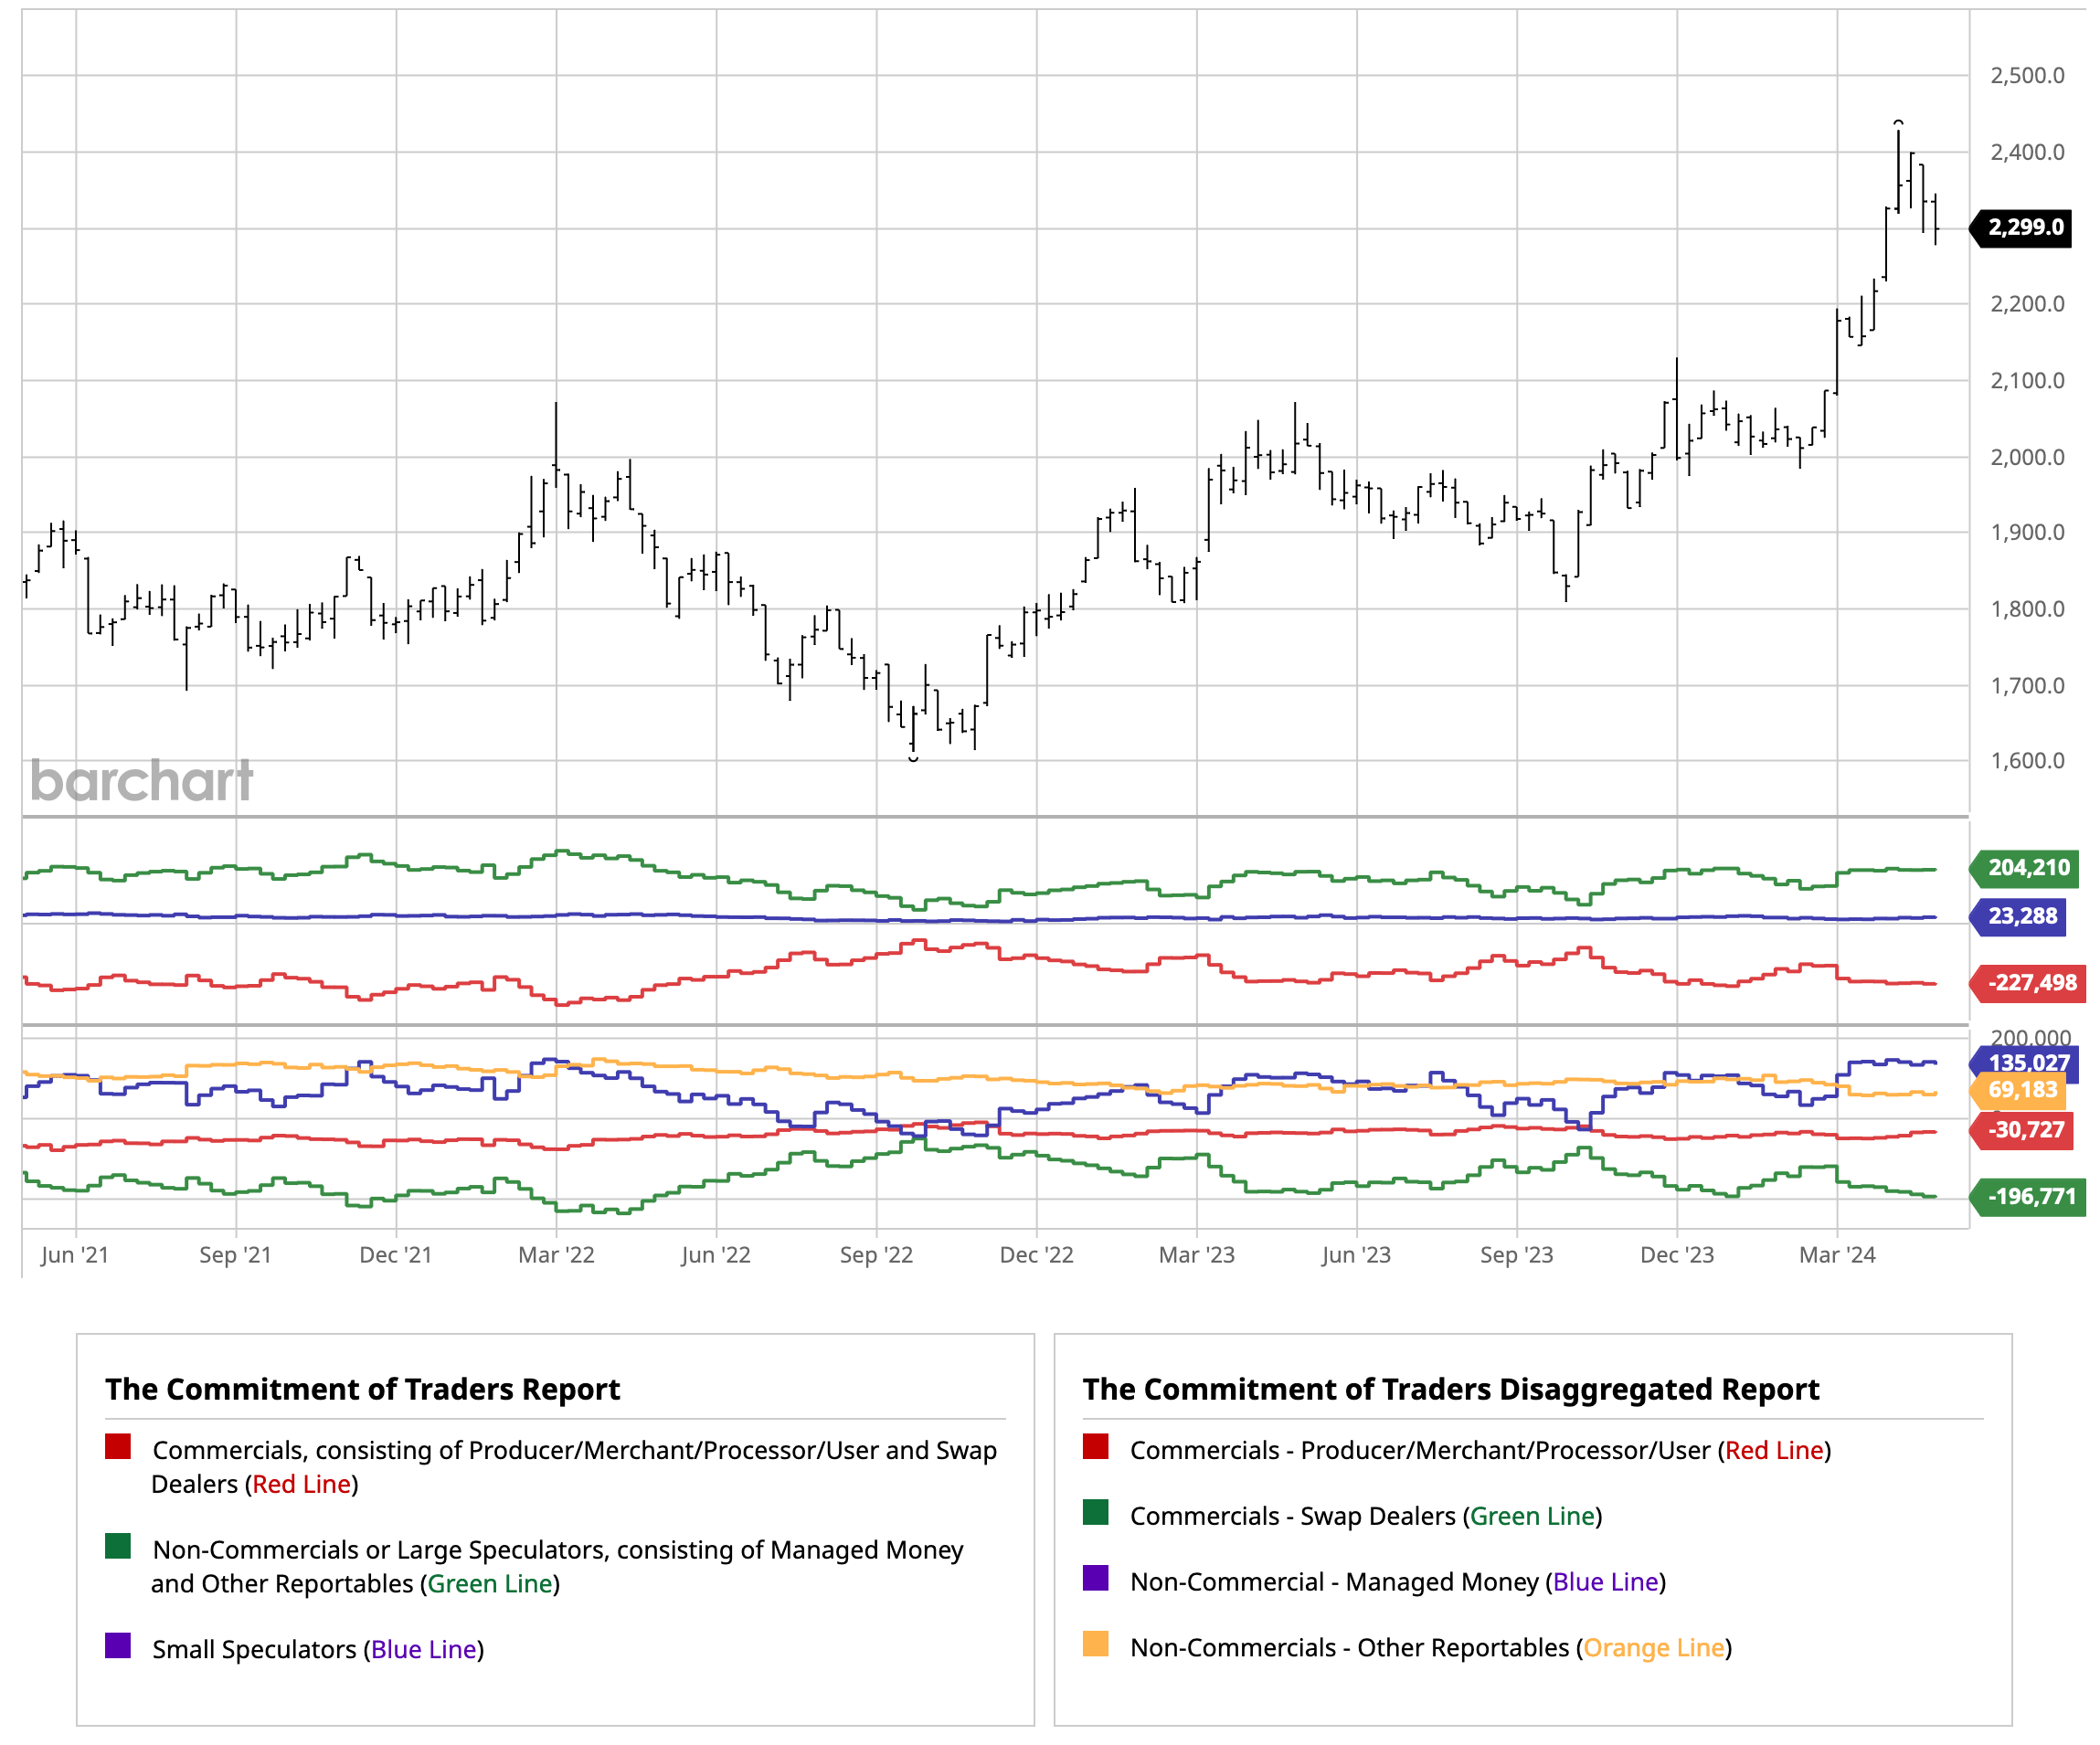
Let’s finish up with a new look at the Commitments of Traders with aggregated and dis-aggregated views of Commercial traders. In particular, this shows that while gold producers, processors and users are net short, they are becoming less so with the recent correction while the evil cabal, I mean swap dealers, are increasingly short and doing the driving where gold’s overall Commercial net short is concerned. Large specs are briskly bullish despite the price pullback. Overall, it is not contrary positive but much like the BPGDM indicator for gold miners, it is also a feature of a bullish market as gold has broken to a new bull market leg that you and I are not the only ones party to.
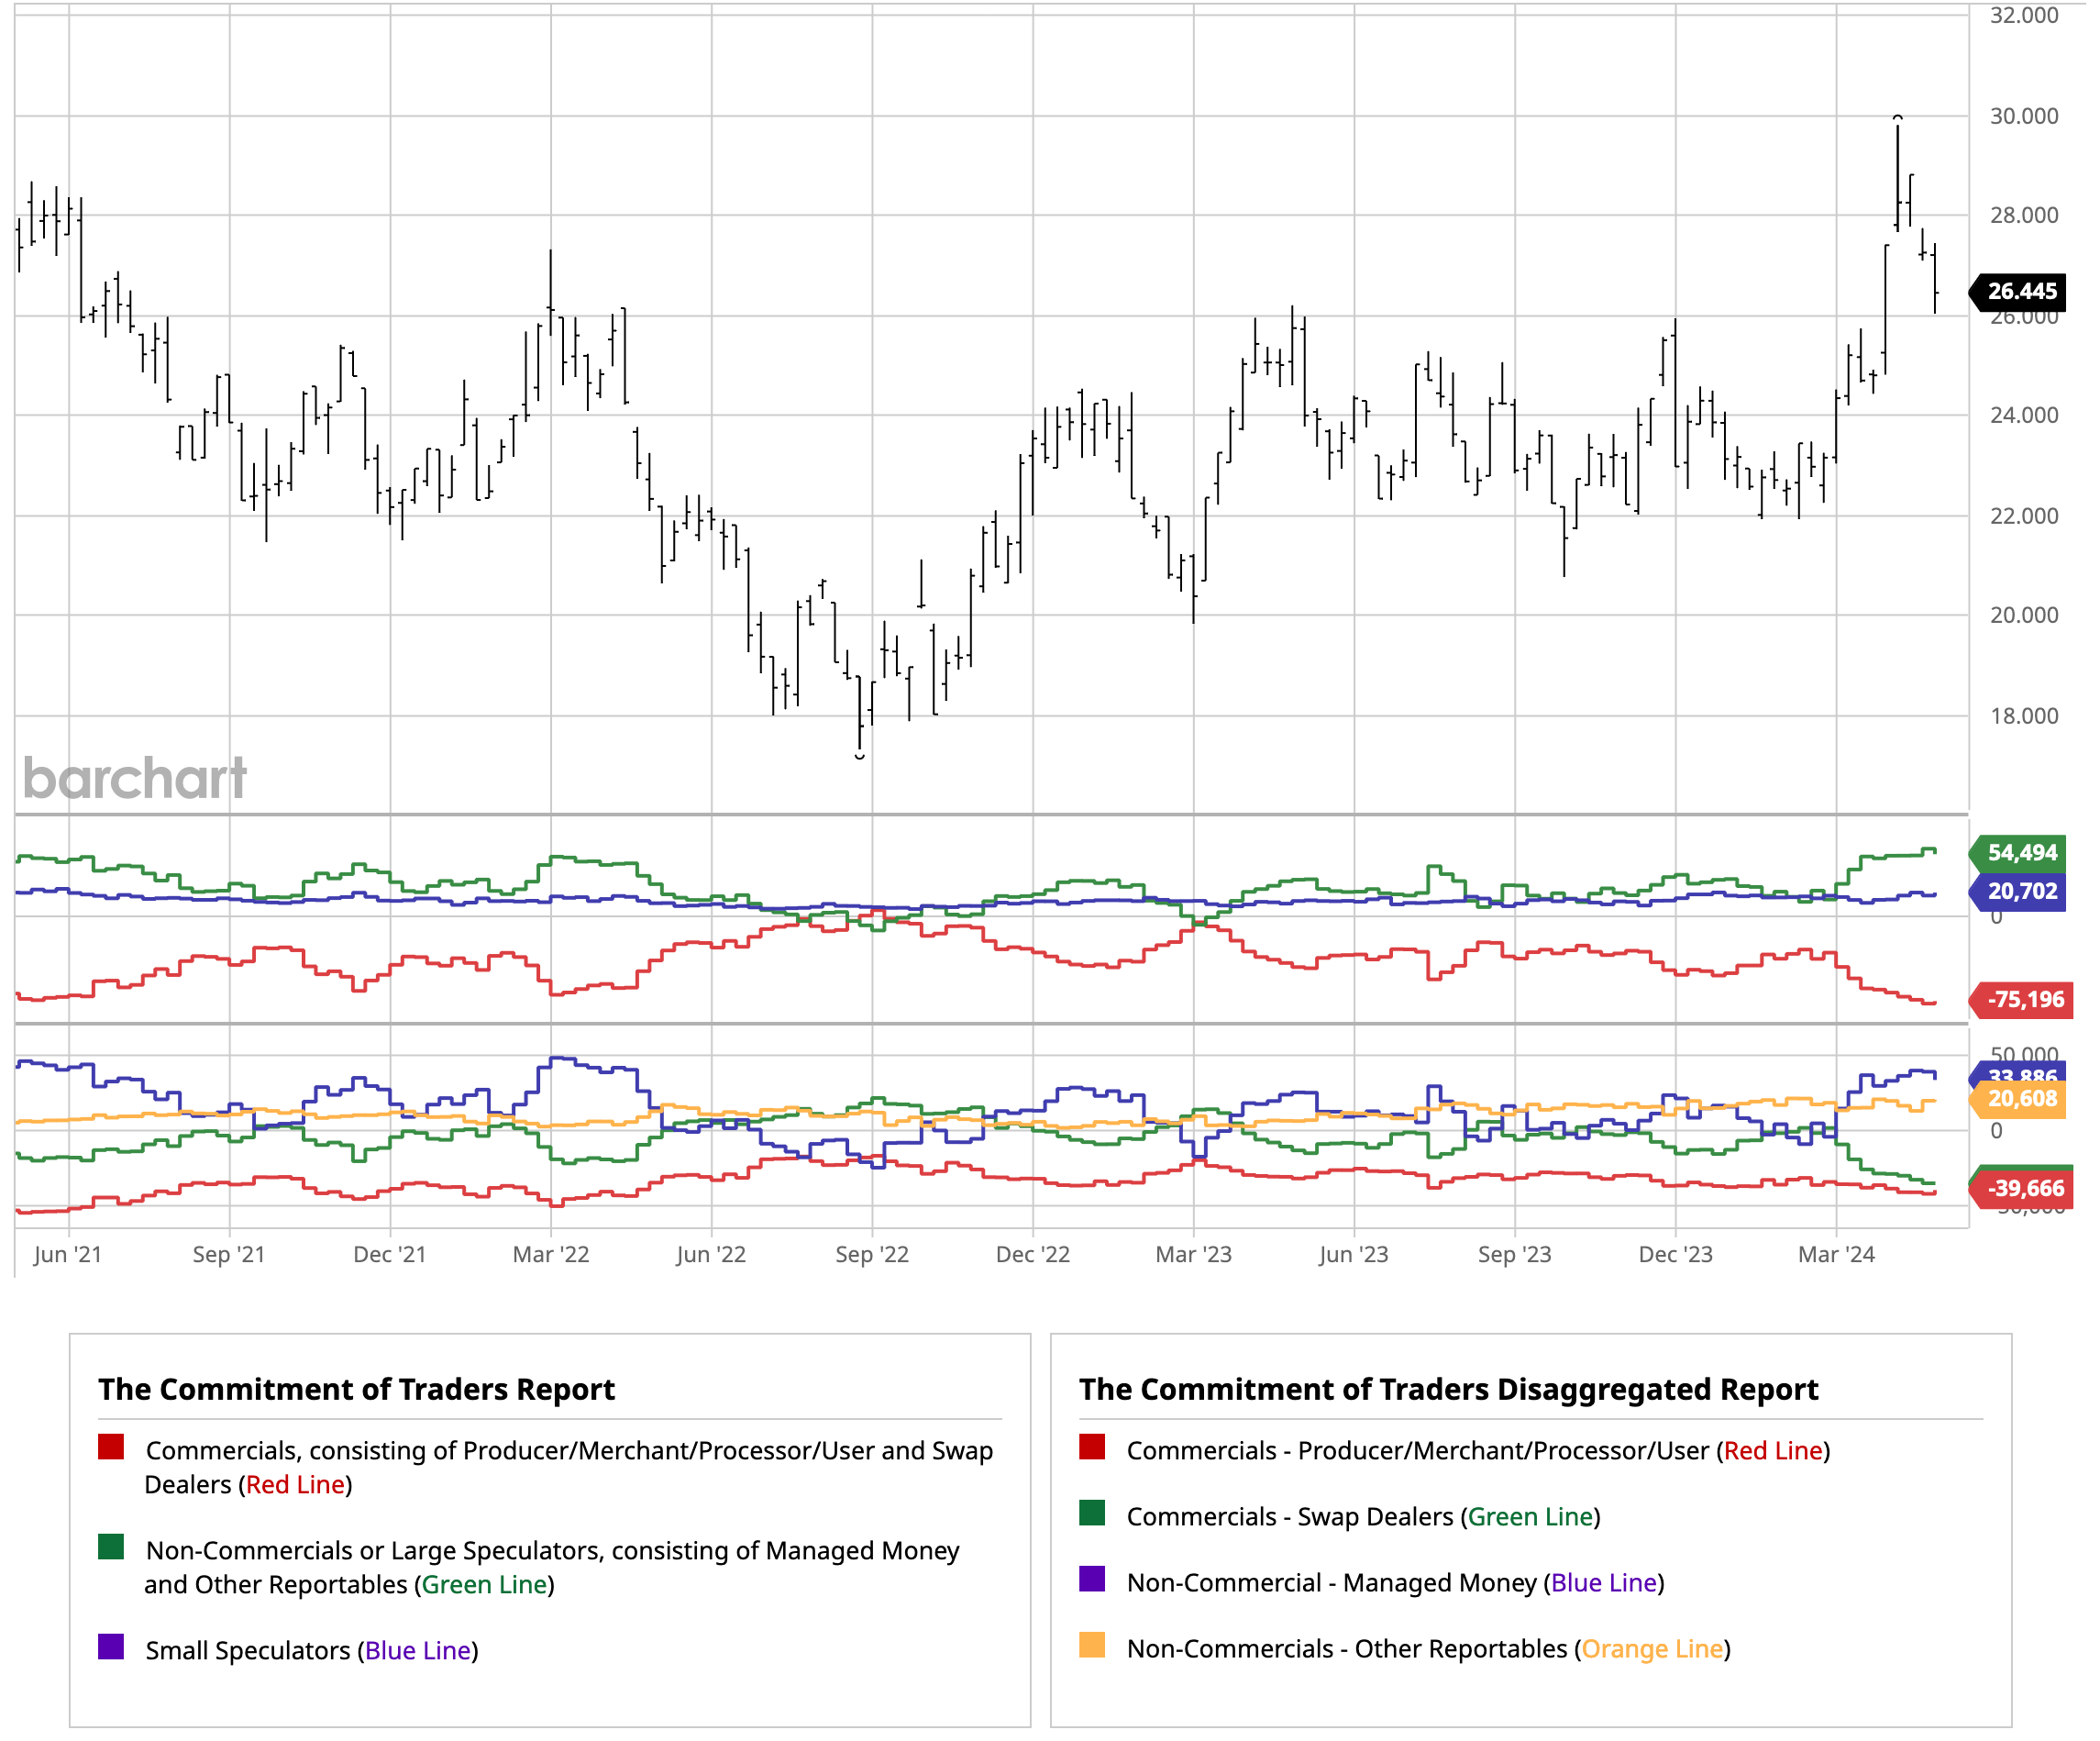
Interestingly, silver’s CoT shows that silver producers, merchants, processors and users the most consistently net short players. I think this has to do with silver’s much more widespread use than gold in industrial applications. Such users may hedge the silver price as a matter of doing business. Regardless, the financial commercials are also very short and the pressure has not eased yet, even with the significant pullback in the silver price. Although Tuesday was a hard down day for the price and that has not yet been factored.
CoT Bottom Line
As it has been for months now. Not at all contrary positive but consistent with a bull market. Not something to be unduly afraid of, but something to keep in mind as the bull continues.
Commodities
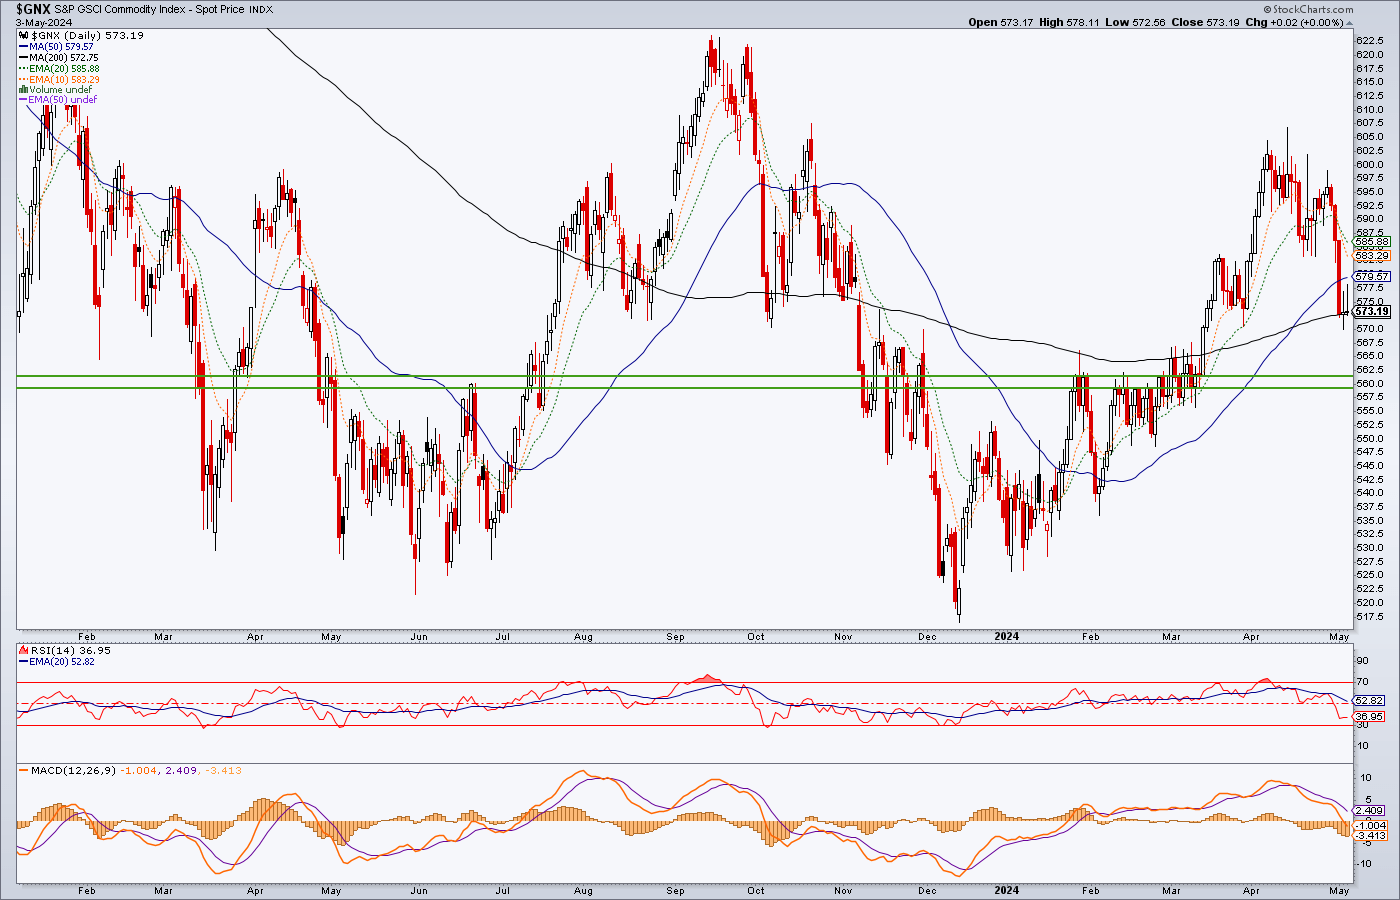
Commodity index has been dropping and ended the week testing the 200 day moving average (573). Problem being, visual support is at 560. So assuming this is not the start of a real bear phase, there could be lower to slip before a sustainable low is found.
Oil is of course driving the bus. Key support at 77 needs to hold or it could go bearish and signal rally over. Crude Oil seasonality is positive into October on average. Seasonals obviously vary wildly, but it’s better to have the seasonal as a tailwind than not.

Gas took a good pop on Friday, reminding us that it is very depressed near multi-decade lows and that its seasonal is also positive (into June, where it tops, drops, and resumes upward into year-end).

The Energy sector (XLE) is testing the 50 day average with initial support just below. A healthy correction would bring it to support at the uptrending SMA 200 in the 86 area.

Copper became overbought, and much like the China growth story it is partly subject to, could use a further pullback. The industrial metals index (GYX) is in similar status.

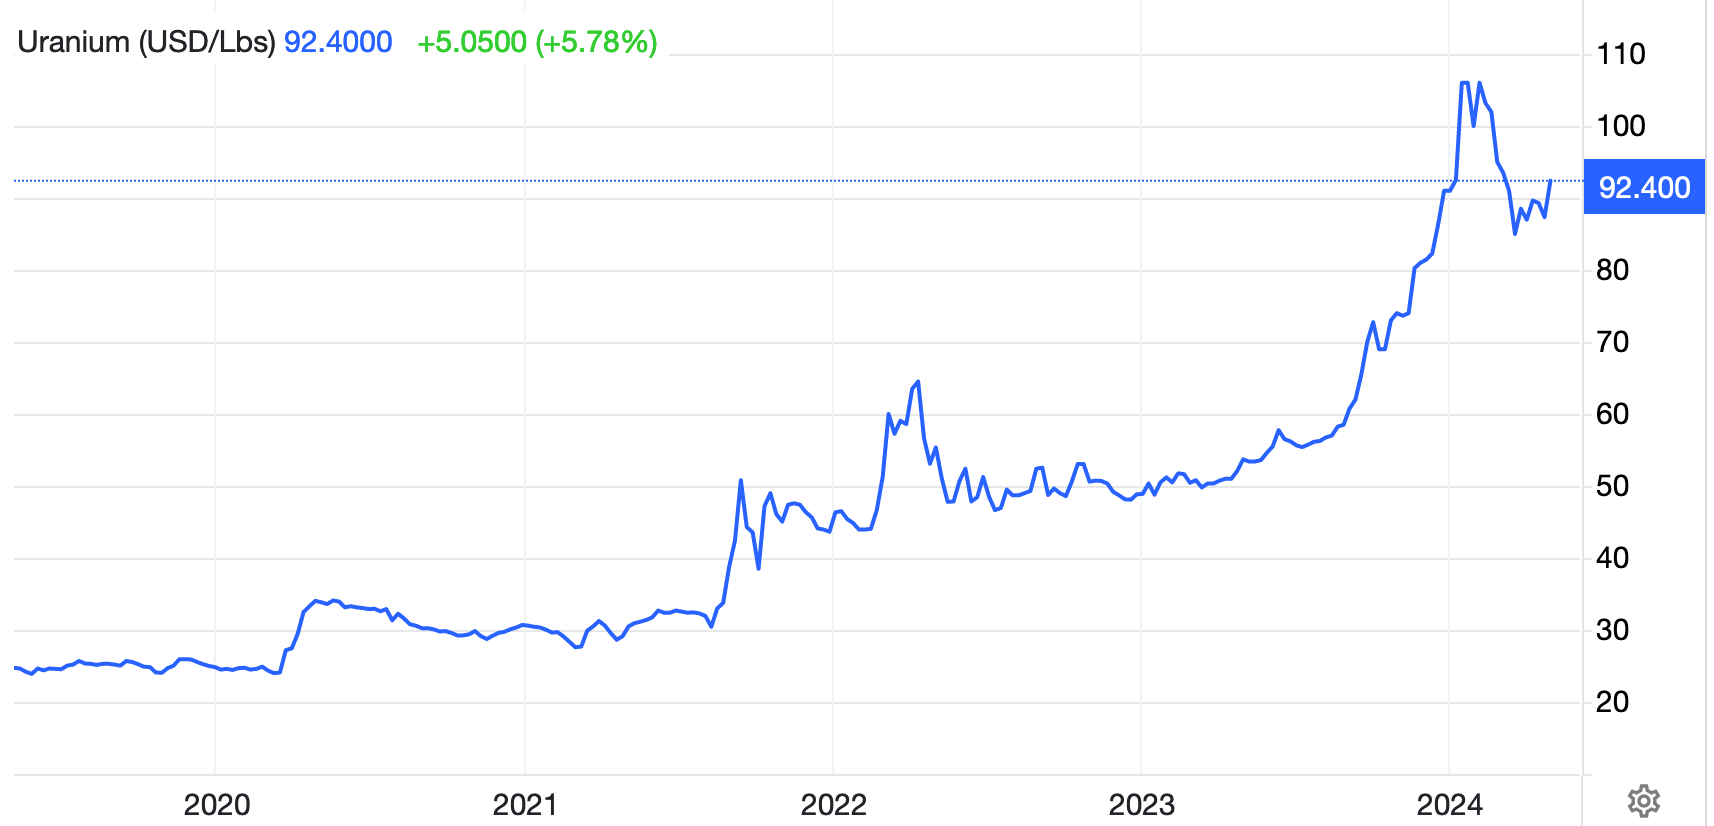
The Uranium price did not sell the news of the US sanctions on Russian u3o8. Indeed, it firmed. This firming came well above any discernible support.
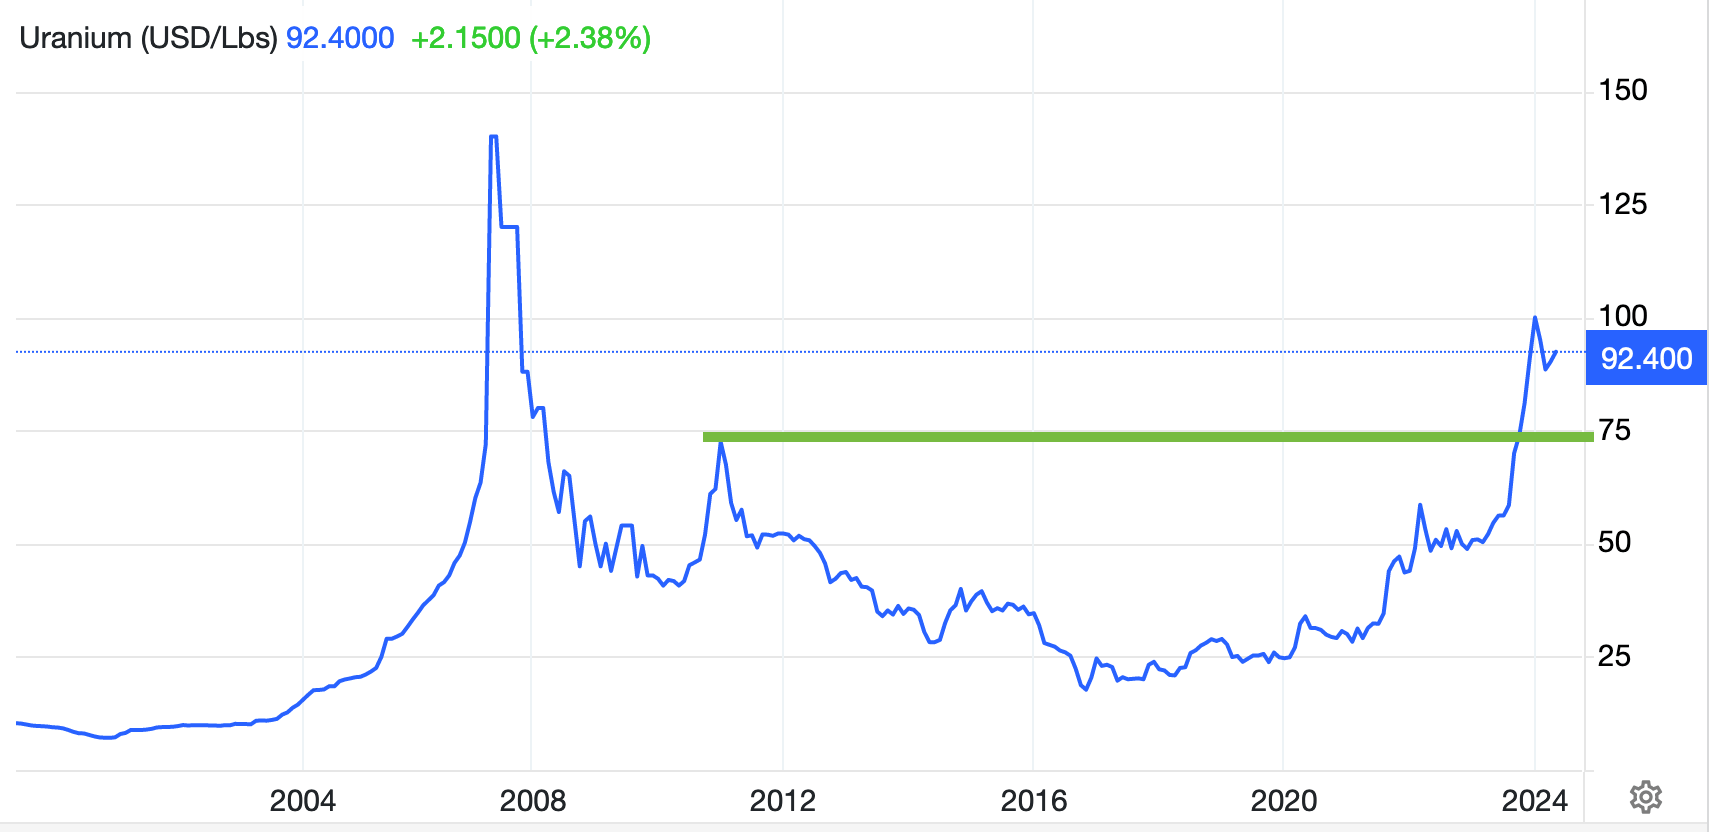
If the Uranium price does sell the news or otherwise correct, support does not begin until 72.50 at the post-bubble 2011 high.
Personally, I’ll just continue to monitor the sector and adjust as needed. Currently holding NXE and UEC. URNM is holding its uptrending SMA 50, but at some point would be due for a test of the major trend (SMA 200, orange).

As you can see at this link, most Rare Earth Element prices continue to be relatively weak in 2024 (although firming a bit), but are up significantly from 2020. Meanwhile, MP Materials, my selection based on its US based production and future processing, continues to be down handily from 2020. Okay, that must’ve been a valuation bubble of some sort, but still, the implication is much greater value now. Factoring in MP’s progress domestically, that value is even more pronounced. This is not a technical buy or an imminent turnaround. But it’s one I try to be in whenever I think it’s got a chance to bottom because one day it may go and not look back. My opinion. Please do your own DD. BTW, nice weekly chart positive divergences by RSI and MACD.

Pd, Pt, Au, Cu and Li play SBSW was added last week after the NFTRH+ highlight on 4.29. It actually turned down after the update and resides below the SMA 50, but within the lateral support area. I will try not to give it too much of a leash, but value is value. When it will be realized is another subject.

Ag index is wallowing along its downtrend. I have little current interest, and that includes the fertilizer guys, MOS and NTR.

Finally, the EV craze is so 2020-2022. I have no current interest in the bombed out ALB and ALTM as the Lithium price still sits on the floor. Nickel, has started to move (still holding TLOFF/TLO.TO), but that could be due to non-EV or its own discrete supply/demand fundamentals and the China story (see industrial metals above). The Li stuff got blown out of whack by the hype back then.
Commodities Bottom Line

The broad sector is rotating Energy > Copper/metals > Uranium > whatever… it’s a game of Whack-a-Mole, which I have long noticed in this sector. One pops, gets hammered, another pops. It’s tradition and the game is fun for commodity bulls I guess. I don’t know for sure because I am not one of them.
Within this, Uranium does have a good structural supply/demand case going for it. Most commodities do as well, but Uranium is coming out of a dark age of fear and paranoia, while copper has been used and accepted forever and oil is subject to sovereign geopolitics and policies. Point being, the whole raft of them is subject to inflation or lack thereof, but their supply/demand fundamentals seem to play a role in the rotations.
Right now, Energy is in correction, Copper appears to need a cool down, Uranium is intact and in my opinion the most interesting long-term supply/demand play (along with Cu) and the sector will generally go with the inflation trades. Hence, we’ll keep track of those indications noted earlier in the report. Right now I am not a commodity bull. We projected a bounce, it came and now it’s time to watch the nature of the pullbacks.
Currencies
Commodity pullbacks you say?
Well, the US dollar index has also been pulling back. However, as the markets generally partied on Friday on the implied dovish Fed signal of the weak Payrolls report, Uncle Buck cracked support, successfully tested the uptrending SMA 50 and closed back above support. Folks, he’s not gonna go down easy. Heavyweight champ, and all.

Should the buck hold and turn back up and should the Fed hawk story continue to weaken, the main bid for USD could come in the form of a resumed stock market correction. A harder version than the routine thing we’ve seen so far. USD is the anti-market and the taker of liquidity.
A draining market liquidity could start to become obvious if USD cracks above the October high of 107.35. Here again we would marry the status of the Gold/Silver ratio to the USD at such time. If they are both on the rise and getting impulsive, Katie… you should bar the door (and manage risk accordingly).
Portfolio
Funds are balanced by gold (long-term risk management & monetary stability).
Holding Au/Cu explorer AE.V in a separate account. It’s a long-term play with much potential according to those much more learned about exploration than I (NFTRH subscriber MC, a geologist, and a mining engineer contact on X). All due caveats about X, but I think this fellow does good work. No recent additions to the position because every time it looks like it may correct harder, it holds its SMA 50.
Roth IRA (non-taxable, no contributions)
Cash (and equiv) is 86%. As you can see, I am more weighted than usual for corrective activity in the markets. DUST is only held as a partial hedge to gold miners, which I am increasingly bullish on in the big picture. SPXS and SOXS are pending the paper thin parameters noted in the opening segment.
If the markets go bull again, I go bull again. If not, I protect gains realized to this point (with the steady if unspectacular consistency of cash income). Sounds simple enough. To be a firmer buyer, I would want a deeper and healthier correction than the one we’ve had to this point. We shall see. The market makes the rules and I manage by those rules.
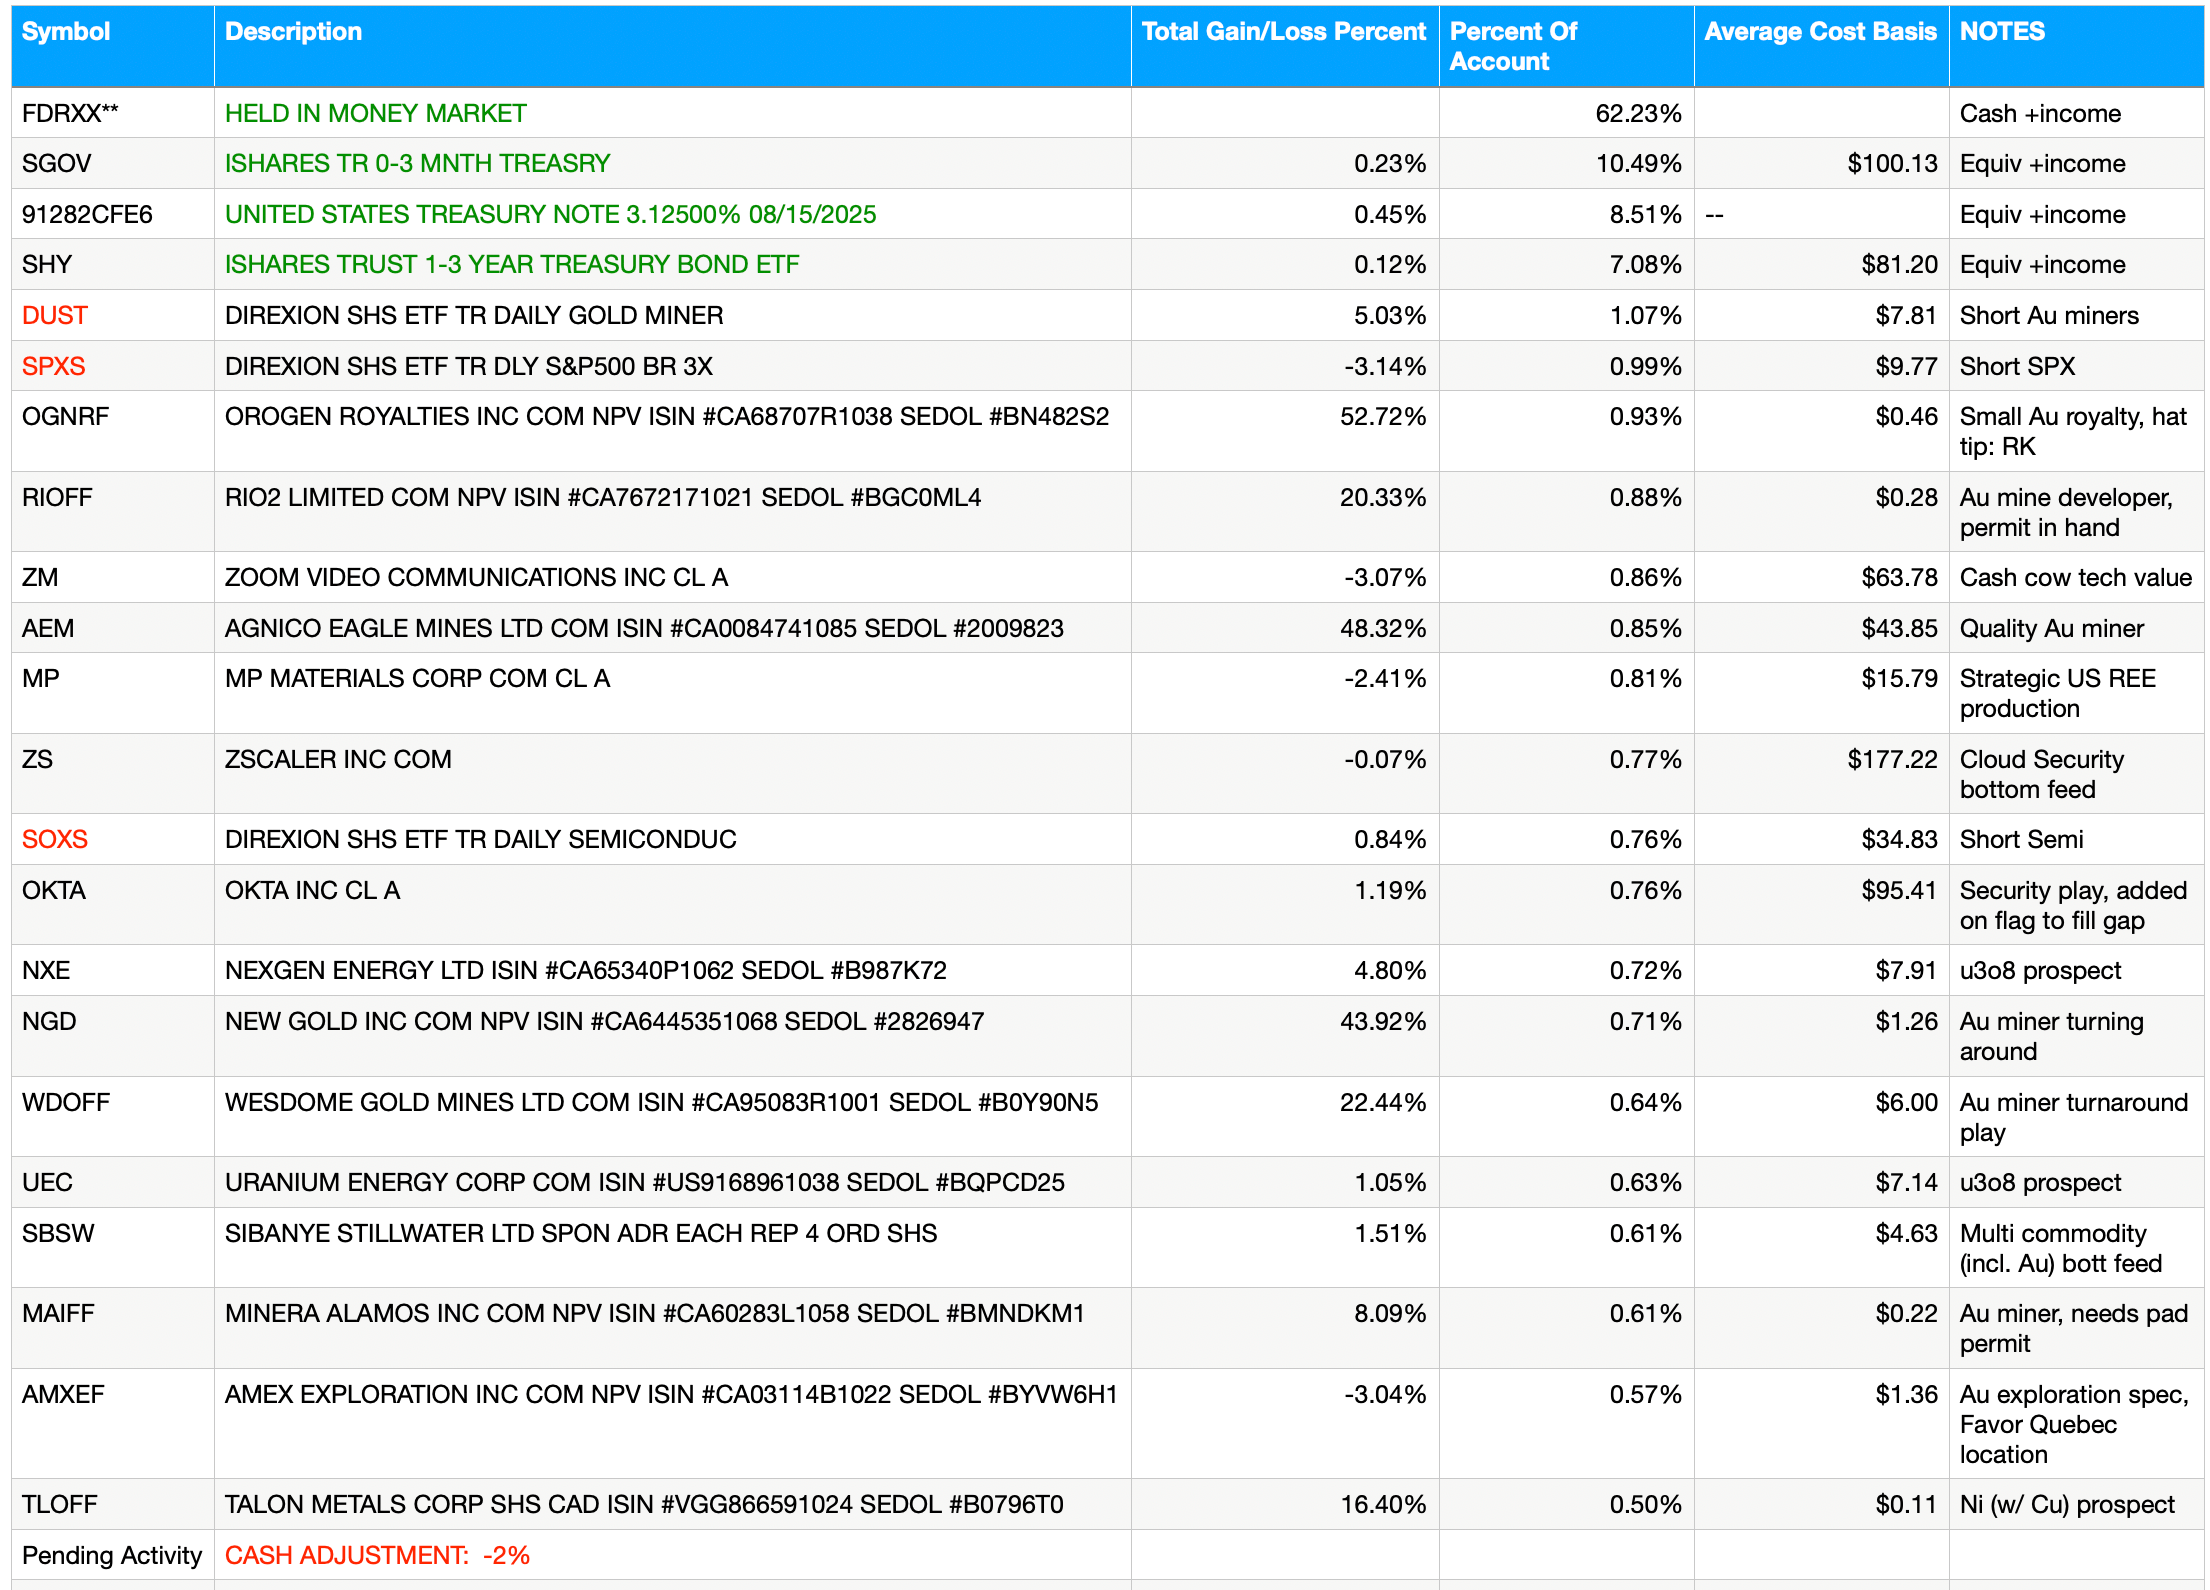
Cash & income-paying Equivalents are at levels that are right for me and my real-world situation. Your situation is different. Cash will be adjusted as needed.
Refer to the Trade Log under the NFTRH Premium menu at nftrh.com for trade info, if interested (not that you necessarily should be). Also, you can follow at Twitter @NFTRHgt for notice of updates.
NFTRH is not to be distributed to third parties without prior written consent
Notes From the Rabbit Hole (NFTRH) is a weekly market report in which we provide analysis on financial markets. We make every effort to provide accurate and high quality content, but this analysis ultimately represents our opinions and these opinions are provided without warranty or guarantee of any kind. See full terms & conditions of service under the ‘About’ heading in the main menu.
