
Summary
US Stock Market: Correction continued, took out 50 day averages and Semi & Tech continue to abdicate leadership. With oversold moves in deep summer, a bounce is possible. But a better bull view could come with a test of the 200 day averages, still well south of here (SPX currently at 4369 w/ SMA 200 at 4129).
US Market Sentiment (per last week): Grossly over-bullish sentiment finally cracking. But there is much further for it to decline if a significant correction (within the still bull trending markets) is to manifest.
New: Sentiment did continue to decline. It is now to a point that could support a market bounce, if one is in the offing. It is not at a point of a major contrarian bull opportunity.
Indicators: Systemic alarm indicators like High Yield Spreads and Libor/T-bill yields are still extreme in their benevolent signals. Tight monetary policy (examples are ‘real ‘ 10 & 5 year yields). By definition the extremes mean risk of reversal is high. Some indicators, like the 10-2 yield curve and the Gold/Copper ratio may already be indicating forward problems for the markets.
Global Stock Markets: Still watching the German DAX as a leader with respect to a potential major double top. It’s not looking good currently. Still, if the USD pulls back and resumes its daily chart downtrend (as opposed to its larger ongoing bull market) a large portion of world markets would likely bounce, given the strong inverse correlation of global to USD. This week we detail a potential Japan trade and also consider the possible effects of the BRICS summit going on this week.
Precious Metals: Sector (gold stocks) has finally achieved the original target of filling the sub-28 (GDX) gap. Now it (current: 27.45) should hold the March low of 26.58 to avoid a breakdown that would target the H&S measurement in the 21s. Gold and silver remain in normal corrections with CoT and contrarian sentiment improving, but not necessarily at a table pounding contrarian BUY! No matter what the cheerleaders cheer. Still, I covered my short due to profit in hand and sector bounce potential. Also added a couple miners. I’ll adjust if no bounce materializes here at downside target #1. Longer-term, if the age of bubble making is finally over, this sector will be unique in benefiting from gold’s standing within a new macro.
Commodities (as per last few weeks): Watch USD’s bounce to test its technical breakdown. If USD fails we’re targeting as high as CRB 305. If it’s a USD head fake and resumed bull the play ends.
New: Last week we noted CRB was noted to have had held its break above the April high of 278.93. That was an at least temporary bull trap as CRB faded back to close at 275.48. It’s still all in the hands of Uncle Buck.
Currencies (as per last few weeks): All about Uncle Buck, my friends. Short-term still bearish. Long-term it’s a firm bull market.
New: USD has pushed the limits, as markets so often do, of its daily downtrend. Halted right at target #2, the resistance coinciding with daily SMA 200. Break upward from here, it’ll get dicey for the macro. Hold at resistance and break down and it could be ‘bounce on’ for much of the macro.
US Stock Market
If the VIX were a stock we’d be viewing it as a downtrend with a bounce that dinged the major daily downtrend marker, the SMA 200. If it were a stock that would have been a handy spot to sell the stock. If you were to sell the VIX it in essence means you’d buy the S&P 500.

I did not buy the SPX, but I covered its short and all other short positions, including against the gold miners. Right or wrong, my gut told me put on my big boy pants and use cash to manage risk while holding only long positions. Markets are at as good a juncture as any to put on a bounce. I say “bounce” because there is another downside objective that is quite viable at the junction of the uptrending SMA 200 (black) and very clear lateral support. The question is whether that support will be tested sooner (ongoing correction) or later (perhaps when a real bear market begins).

Here are some options and my opinions of them:
- Market bounces now from support at 4300 (+/-) and continues upward, perhaps to the 4800 target. This would be the less healthy scenario for the stock market, longevity wise.
- Market continues bearish (whether or not it makes a bounce attempt first) in a late summer scare fest, and tests support from the 4200 area down to the rising SMA 200 (4130). If such an intense clean out were to happen and support holds prior to a new upturn, this could actually replenish the bull through year-end and well into 2024.
- Market makes such a test, fails, and a bear starts sooner, not later.
Currently, I see the first two options as more likely than the last one and within that, slightly favor option 1. But let’s be aware that with the recent sentiment extreme and price activity that for all intents and purposes has tested the previous bull market highs, a new bear can start any time. The main reason I don’t trust this correction as the beginning of a bear market is that I don’t trust summer trading, wit da boyz in da Hamptins and the machines, never on vacation, doing as they will.
Finally, the leadership chart shows Semi & Tech leadership still in short-term breakdown mode. I hold a couple of Semis on the prospect of a market bounce, only. If that proves wrong, adjustments will be made.

Generally, I currently favor an eventual test of the daily SMA 200 (SPX) and a longer bull run before the bear market begins. But with the indicators below so extreme, I will be ready to alter that notion as needed.
Macro Indicators
The 10yr-2yr yield curve is well on our theme of a new steepener, which is developing nicely. There was something about that secondary deep inversion that made me think “b/s”.
There are a lot of moving (inflationary and/or deflationary) parts to a yield curve view but let’s keep it simple and note that the curve usually flattens with a financial and economic revival (boom) and steepens with a bust. So sure, we’re deeply inverted. But the steepener to follow will eventually most likely be attended by an economic bust. For the same reasons this would be negative for the cyclical, risk ‘on’ case it would be positive (in relation, at least) for gold and its counter-cyclical aspects.

The real yield on the 10yr Treasury note shows very tight monetary policy (as does the 5yr). This is not good for gold or the risk ‘on’ cyclical world. This is good for holding cash. But this and the two (lack of) stress indicators that follow it do indicate high risk of reversal. When things are pushed to extremes risk is, by definition, in play for a reversal in the opposite direction.

High Yield Credit Spreads continue to indicate all calm (and high risk).

Apparently the stealth inflation injected by monetary authorities has not only worked to keep the stock rally going, but also to keep the risk in the banking sector well under wraps, according to the Libor/T-bill yield ratio.

Within the signaling of the an inverted yield curve, high ‘real’ yields, calm credit spreads and banking, the disinflationary 2023 has not surprisingly brought out the soft landing brigade. Like bugs to a light they follow the disinflationary Goldilocks theme and conclude soft landing, happy days are here again!
No, they are not. What is here is money supply (M2) slowly deflating back toward trend. Think of the distortion as a bag of seed corn grown by the Fed in the 2020 panic. Indeed, I have seen analysis touting the gap between the still elevated M2 and its prior trend (blue arrow) as ample liquidity injected and still sloshing around the markets.

Well, sure. It is. Indeed, there has been a little hook upward in the percentage rate of change in M2’s year over year contraction. Monetary conditions are still extremely tight the way the Fed is operating, and by the look of the yield curve, it does not appear a soft landing is what will follow Goldilocks and precede the next inflationary operation.* More likely, an economic bust of some minor or major magnitude, will precede it.

* Of course, with the implication of this macro picture of (inflationary) “license revoked”, does the Fed even have the implied license from the market to proceed with inflationary business that was ‘as usual’ until 2020? In other words, do the Fed’s inflationary sins of the past force them to remain firm even when things start breaking?

Market Sentiment
Dumb money sentiment indicators show a big drop in over-bullish sentiment. This combined with the likes of the VIX, gave me pause about being short in the short-term (when cash is ‘no lose’ risk management). But with the recent extreme to at least inversely match the Q4, 2022 extreme it is time to be well aware of ending stages of what I think will turn out to have been a false dawn bull move in 2023.

As for other indicators…
- NAAIM (investment managers) were already in full retreat on Wednesday, before more down action followed. NAAIM had declined from slightly leveraged above 100% to 60% on the 16th and likely less bullish now. It’s also permissive of a market bounce.
- Investors Intelligence (newsletters) smashed down from a bull/bear ratio of 3.07 on August 1 to 2.36 on August 15, again with consideration about more bearish activity after the reading was taken. Also permissive of a market bounce.
- AAII (Ma & Pa) bull/bear ratio smacked down from a high of 2.3 to 1.2 on August 23. Same status as the indicators above.
Sentiment Bottom Line
Over bullish sentiment has not nearly been fixed to the degree of a clear over-bearish backdrop, but it has been adjusted to the degree that would be consistent with a market bounce or even an end to the correction to a still uptrending market.
Global Stock Markets (daily charts except as noted)
Please take due note that local currencies play a role in market performance for global citizens. NFTRH being American, cannot get too far afield managing all those moving parts with my simple charts. So global market comments and charts are for reference.
German DAX had another difficult week, ticked the weekly chart’s RSI negative, sports a still triggered and rolling MACD and asks us to consider the potential of two things:
Thing 1: is this a major double top?
Thing 2: is the DAX a leader, a blue print for what’s ahead for other developed world markets?
I take each of those questions very seriously.

I’ve talked a lot about the Japanese Nikkei and the target we plotted long ago. In rummaging through the chart list I came upon the monthly chart originally used to project the measurement out of the long-term base. I hear mainstream analysts touting Japan as one of the few long-term bullish markets. But if the target of 35000 or even a test of the 1990 high is in order, even then the risk/reward does not look good for an investor. A trader might see it differently.

On to the dailies, we’ll start with Japan and continue to note that a drop to test the uptrending SMA 200, coinciding with the green shaded support above, could be a ‘buy’ for traders to play Japan’s perhaps final act.
In light of the recently strong USD, Hong Kong, Asia, EM and China are all technically poor. Cue the “dedollarization” cult and whatever excuses they may have at the ready. I am no fan of the way America does financial business, but some “analysts” seem to have a fetish about the end of the US. The promo is that the BRICS (see next segment) and their resource rich economies are rising up against the great Hegemonic US and its monetary chicanery.
A good pitch and it’s got some essences of truth. But let me ask you, do you remember Jim Rogers in his southern drawl circa 2005 (+/-), probably on Jim Puplava’s old radio show? “Ahhm teachin’ mah baby girl Manderin”. That was promotional gold, I tell you. I am not criticizing a pro-China investment view (on the very big picture). I am critiquing the phenomenon of herds grasping hold of sound bites and info blurbs, acting on them in any given shorter time frame and getting punished for their actions.
Moving on, India is on a normal correction and Canada’s TSX-V is not signaling well for the inflation trades. Sure, it could bounce from oversold conditions, but that is sure not bullish.

The World (ex-US), being firmly anti-USD…

…is right now on an important test of uptrending SMA 200. The implication is that if Uncle Buck somehow busts bullish, the “bust” so to speak, would impair global stocks badly.
As to the chart, none of this is bullish. It’s neutral at best, with the exception of the bearish UK.

Brazil is neutral w/ a bullish bias as it looks to perhaps test the SMA 200. Argentina took a new leg up in its inflation bubble. Mexico continues to give the look of a rollover, Africa ETF is bearish and Frontier ETF is breaking down in a hard correction.

Currencies
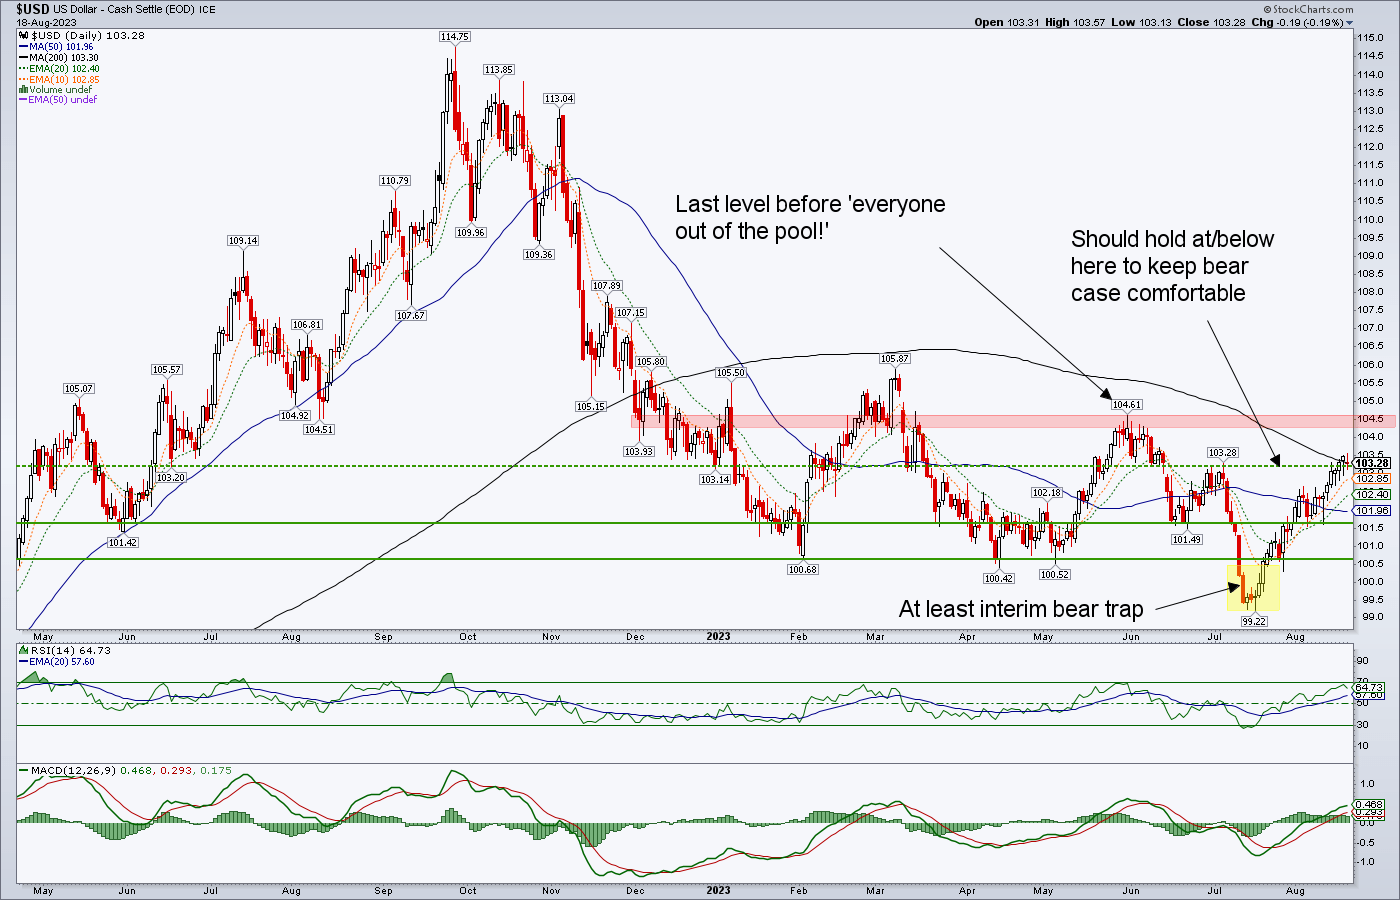
Focusing on the currency that matters most to the global macro. The once and still relevant global reserve currency, the US dollar (daily chart). It was a bear trap, in play for a month now. USD trapped traders and “dedollarization” believers and reversed as we suspected would be the case. Now USD is at an epic critical decision point.
Technically, USD should hold at/below the SMA 200 to keep an anti-USD view comfortable in the near-term. Long-term, please remember it is a USD bull market. But the heat would really get turned up if it gets through here and challenges the May 31 high of 104.61. If it gets through there? Well, the chart’s note instructs…
Next week something called the BRICS Summit takes place. Fetishists of the end of America’s world dominance use this forum as a basis for the “dedollarization” theme. I think America’s financial system is rotten at its core, but this emotional cheerleading is not healthy. It is much like another flavor of gold bugs’ preoccupation with the banking cabal and its schemes to keep gold under wraps. It’s idealistic and perhaps has morality on its side. But without proper market management, morality is not going to buy you much, other than your intact soul.
In other words, this stuff gets people thinking with their emotions, their hearts, rather than the brain behind their own two eyes, which should be seeing what is actually happening.
That little screed behind us, the BRICS Summit could be a handy excuse to knock Uncle Buck out of his rally. The world is getting oversold and global hype event is taking place. All while USD resides in an important resistance zone. If nothing else, this event could rhyme with other reasons a broad market bounce could erupt.
Precious Metals
Thursday’s public post shows a seasonal pattern for GDX that bottoms soon. This year it looks like a good plan, considering the duration of this correction. The low could come in September, possibly to test the Q4, 2022 lows or now, at a higher low to the original correction target, the March, 2023 low.
I thought long and hard before dropping the miner hedge, DUST. The profit – hard earned as it was – was too good and the potential for a sector bounce too good for me to chance letting said profit go. That of course means I am vulnerable to further corrective activity, to the degree I am invested (not overly, for sure).
This is the type of thinking that has thought me right out of glorious downside wipe out short opportunities in the past. But in the past cash has not been paying out nearly as well as it is today while acting as a risk manager. So if the worst (actually best, from the perspective of a future buyer) happens and the March low is taken out I’ll probably raise more cash and wait for the 21-22 area and what could be a big time buy opportunity.

As to the daily GDX “management” chart, it’s simple. Bounce from or above the March low off of an oversold condition or prepare for a more intense buy on the lower gap fill. In that event, the H&S top, originally noted on August 3, would have played out.
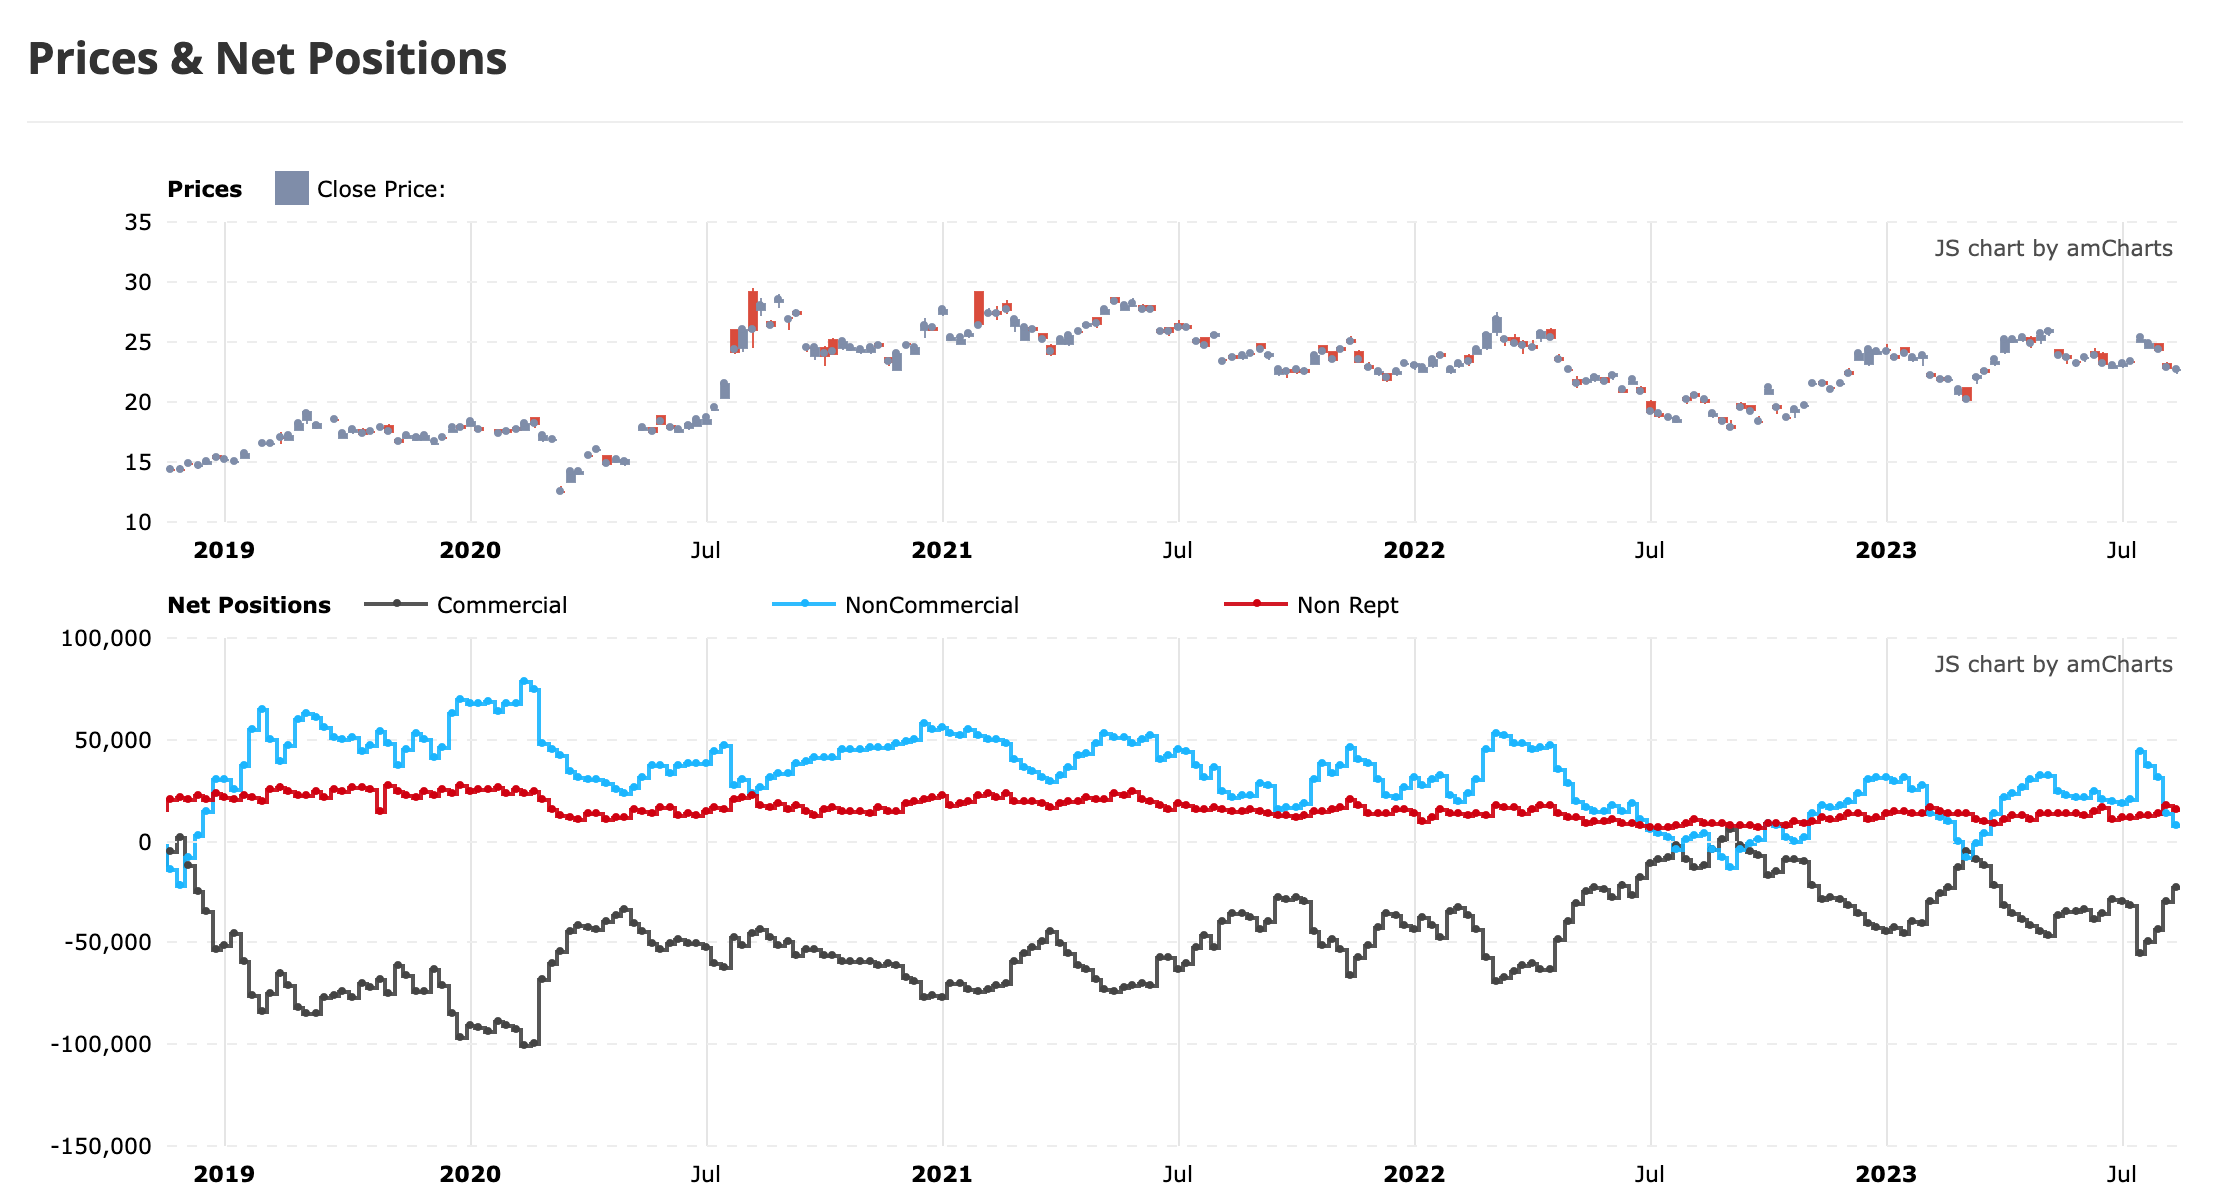
Moving on, there was some Twitter noise by Twitter influencer (what a horrible term) about how grand the Gold Commitments of Traders (CoT) was last week. Well, it never did become extreme to the unhealthy side and on the subsequent reversal it is now benign. However, price turns when the trend is exhausted. There is no evidence that the CoT trend has exhausted. The plan continues to be that CoT signaling was for a gold correction only, not anything more bearish.

Silver CoT is even better, taking a hammering in speculator sentiment and an up spike in Commercial short covering. As with gold, however, the trend may not be over.
While CoT is well on the way to a favorable risk/reward setup, the Public Optimism Index is on a similar message. I have indicated major buy signals on the chart. But our thesis for the current correction is that it is not major, as in a breakdown, but instead is more routine. If that is the case Optimism does not need to drop to the previously noted extremes. Risk/reward is positive although there could of course be lower to go. But the point is that I am not expecting a major reading like those I’ve marked up, prior to gold’s next bull phase.

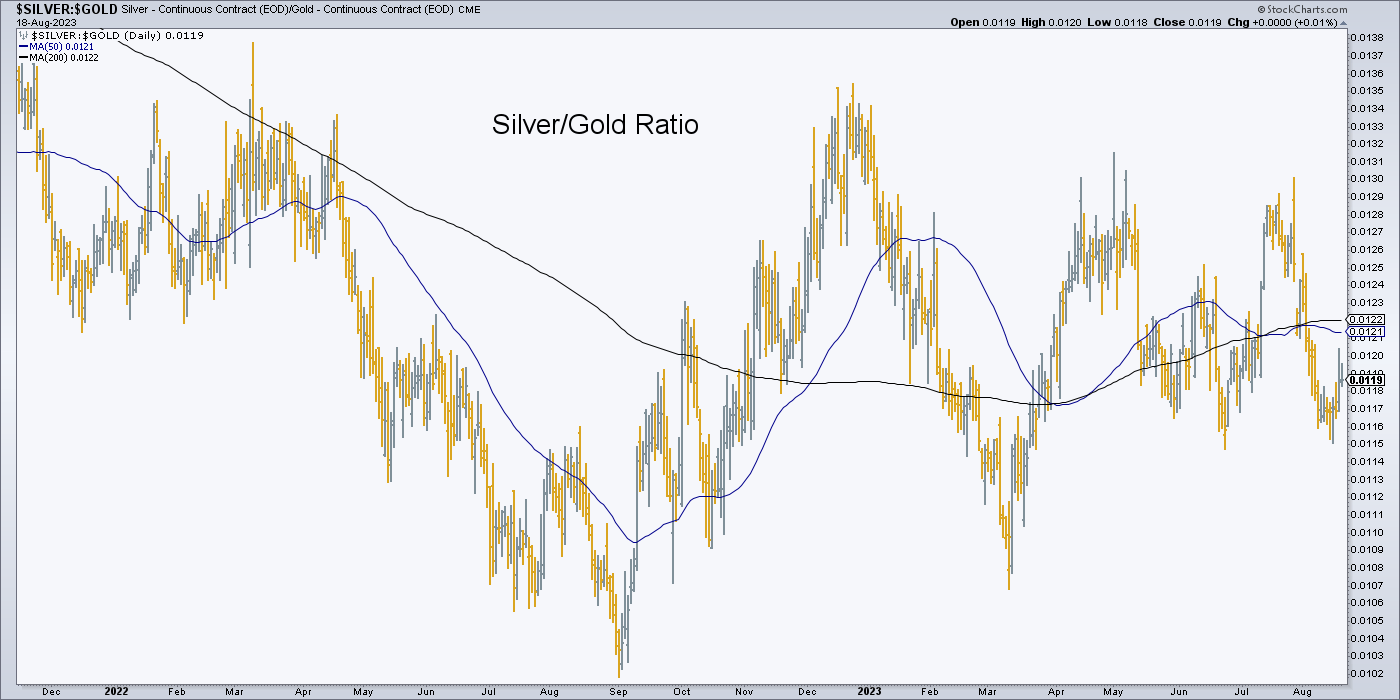
The Silver/Gold ratio is conspicuously intact and as such would be an ally to the global bounce/rally theme (and an adversary to USD) if it continues to turn up from the recent low. That would likely include include the gold mining sector if it comes about. The miners tend to follow silver better than their own product, gold. Inflationists and all.
Let’s expand the market ratios fundamental chart to a longer view this week. The weekly chart shows Gold still slithering support areas vs. US and global stocks. No upturn, but no breakdown either.
The weekly chart shows how minor gold’s pullback has been vs. CRB index and crude oil. On the flip side, it’s previous rally was not yet a major thing to behold. It’s a process, this turning the macro stuff.
Speaking of which, Gold/Copper, a very significant global cyclical indicator, is still trending bearish for said global cycle. China and its economic woes are behind this and hopeful copper/cycle bulls tout an impending move by China to liquefy its markets. Hence, a market bounce can happen at any time but in general let’s call the Gold/Copper ratio an indicator at odds with indicators noted above that are still implying calm waters.
What we are looking for with respect to an extended bullish gold mining view is for all of these ratios to be grinding upward. Not necessarily spiking as in past macro panics (that yanked our friendly policy eggheads into inflationary action), but establishing long-term upward trends.

Gold (daily) is still corrective and it is still normal. Currently testing the uptrending SMA 200, it would remain unbroken even in the extreme case of a drop into the ‘must hold’ zone. The key is a higher low to March.

Silver (daily) is attempting a bounce from the June low. But I would not at all rule out an eventual decline to where the top of the shaded base meets a higher low to the March low. The question is, will a bounce manifest first?

Commodities
If USD is preparing to get repelled back into its daily chart downtrend, the commodity complex would likely get a lot of relief. CRB target is 305, in that event. But the daily chart is currently indicating a bull trap pullback after the previous breakout. Without over complicating things, it really is USD vs. most of the world, especially including commodities. If USD is finishing up a bear trap rally, CRB could end a bull trap pullback. If USD goes bullish? You know, all of this stuff will be risky.
Oil ticked a bull trap and pulled back. Gas continues to slither not only the daily SMA 50, but per the monthly chart below, very long-term support. Industrial metals, especially in the face of decelerating China, is bear trending, as is headliner, Doctor Copper. Regardless of what the ETF is saying, the Ag index is firmly trending down.

Here’s the big pic Gas view. With a seasonal low coming in September (on average), the potential for Natty to break upward from its base shown above is there.

The Uranium sector wobbled but ultimately closed the week intact. I made sure to watch the charts and in not cracking the 50 day averages I held. That includes FUU.V, which did crack the SMA 50 for a test of the SMA 200 (now shown). This happened after a ‘bought deal’ was announced, which is one of the hazards in the road to investing in Canadian TSX-V listed resource stocks.

Here is the other riff raff. Rare Earth ETF and REE watch list item MP are trending down and bearish.
Lithium producers LTHM and ALB have been punished with a decline in the Li price. They are on watch. The items on this chart are in “show me” mode with what I want shown to me is a failure in the USD before I starting showing confidence in this stuff, even for a trade.
The same can be said of PGM (and Au, Li) producer SBSW and certainly little TLO.TO, a nickel property owner and one day a potential investment.

Portfolio
Savings balanced by gold.
Trading Account: No positions (shorts on SPY & QQQ covered)
Roth IRA (non-taxable, no contributions)
Cash is about 82%. All bear positions sold. Prepared for a broad market bounce. If that happens I may add some positions for a trade. But if the summer correction has further short-term downside, I’ll probably raise more cash. With respect to SPX daily chart (second chart of this report), the best buy area – assuming an ongoing bull phase – would be at the support coinciding with the rising SMA 200. As noted in the report, I think that a harder summer correction would actually help the rally’s longevity, whereas a bounce now that continues upward, would not.

Cash & income-paying Equivalents are at levels that are right for me and my real-world situation. Your situation is different. Cash will be adjusted as needed.
Refer to the Trade Log under the NFTRH Premium menu at nftrh.com for trade info, if interested (not that you necessarily should be). Also, you can follow at Twitter @NFTRHgt for notice of updates.
NFTRH is not to be distributed to third parties without prior written consent
Notes From the Rabbit Hole (NFTRH) is a weekly market report in which we provide analysis on financial markets. We make every effort to provide accurate and high quality content, but this analysis ultimately represents our opinions and these opinions are provided without warranty or guarantee of any kind. See full terms & conditions of service under the ‘About’ heading in the main menu.