Looking at it through the lens of the inflation/liquidity indicators and the anti-liquidity indicators we find Team anti-liquidity with an upper hand of late with Omicron providing an excuse for markets to reject the inflation theme, in the interim at least. The bottom line of what I see below is that it’s a cool down of the inflation trades, but they are not busted. There is not much more tolerance to the downside before they would be busted however, so it’s coming decision time.
As a side note, it’s no coincidence that gold stocks are doing relatively well since they benefit fundamentally from waning inflation and often bottom and lead new inflation phases. All of this is happening on a short-term basis.
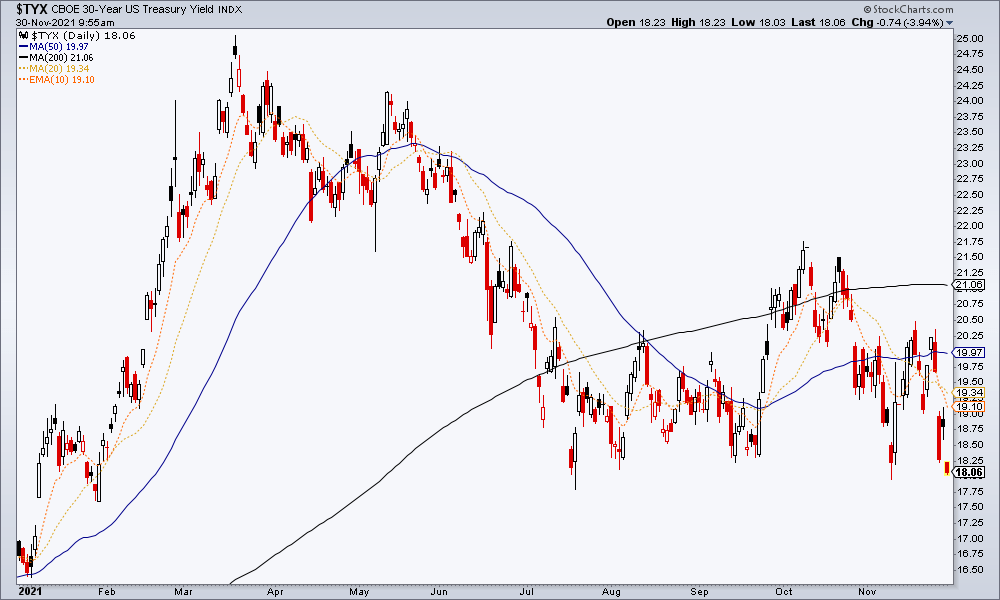
Long-term Treasury bonds are rising, which means yields are dropping. In this case, the 30yr yield is dropping enough on the daily chart to continue compromising the would-be right side inverted shoulder we’ve tracked for much of the year on the monthly (Continuum) chart. Here’s the daily…
Here’s the monthly view for reference.

Both USD and the Gold/Silver ratio are pulling back this morning, but neither is broken. Here is the daily GSR.

While inflation expectations are also pulling back within an intact daily chart uptrend.
