In NFTRH 680 we took a look at the seasonal patterns of November through February, noting that on average the markets were entering a seasonally positive time of year. Let’s review again, understanding that they are just 30yr averages and certainly not to be taken as anything more definitive than that.
Looking closer into it we see that whatever disturbances are happening this week are consistent with the November average, which gets a little rough into Thanksgiving and tends to recover after.
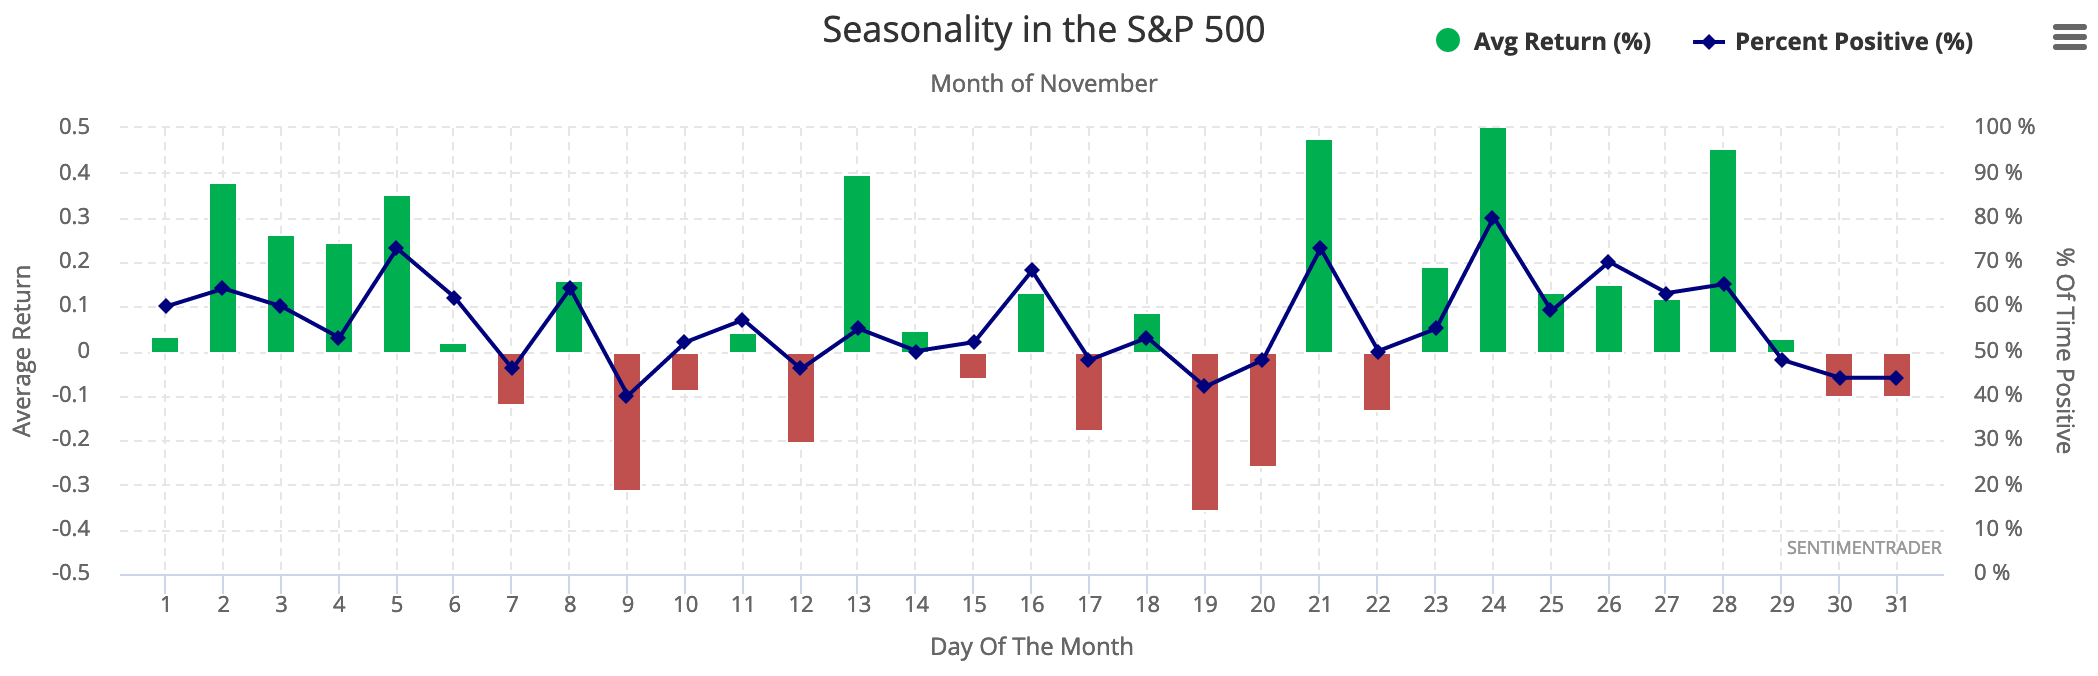
That recovery lasts into the first week of December before another choppy spell preceding the traditional ‘Santa rally’.
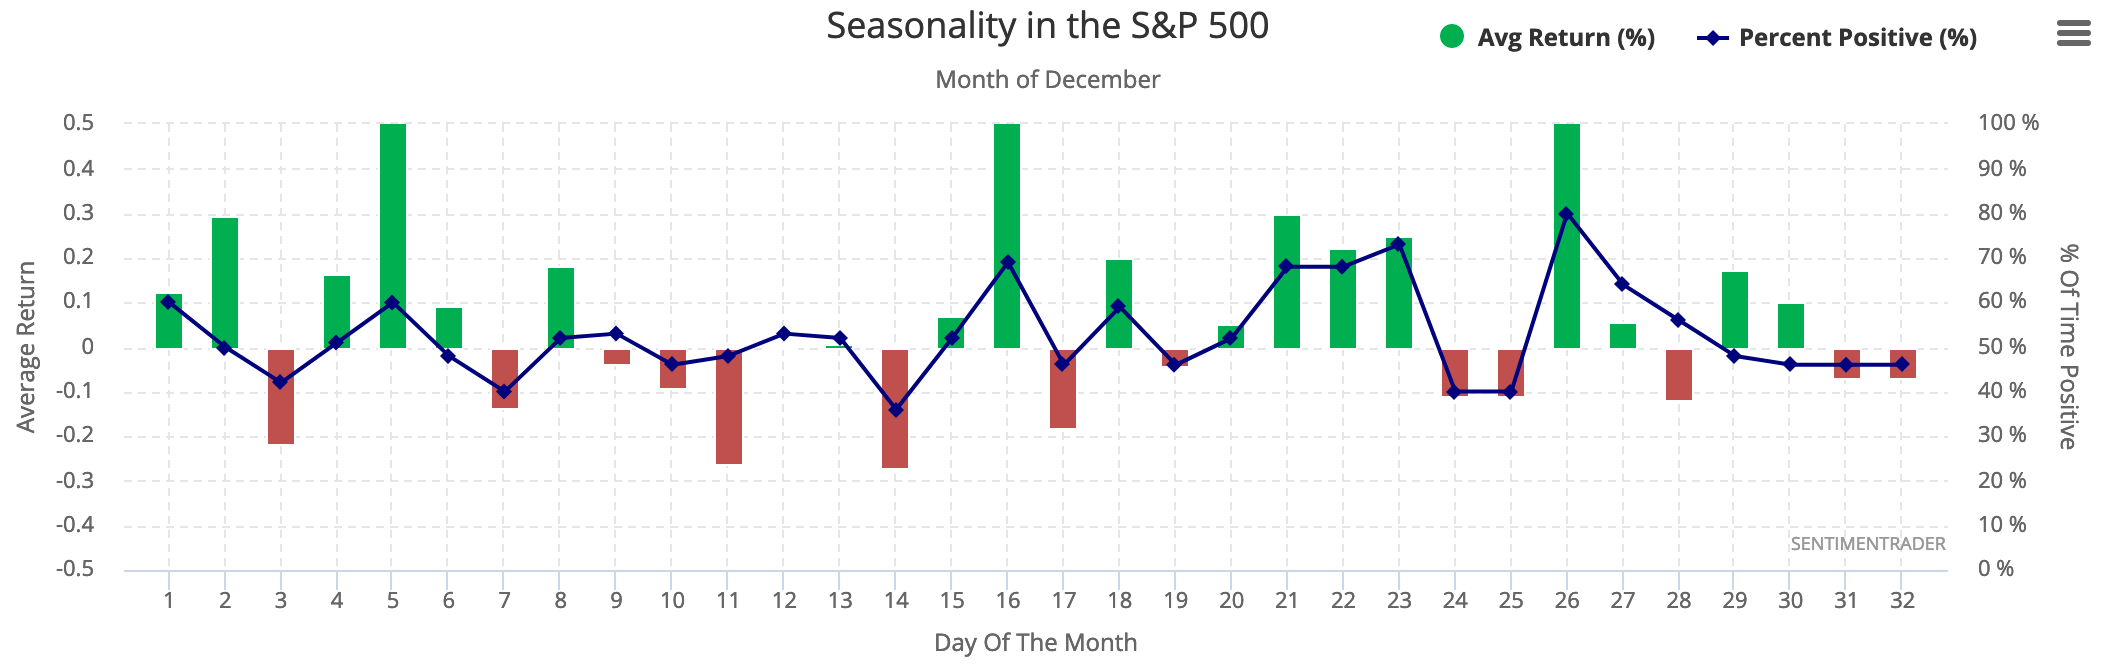
January then starts off well and with a few bumps maintains a bullish bias, ending strong.
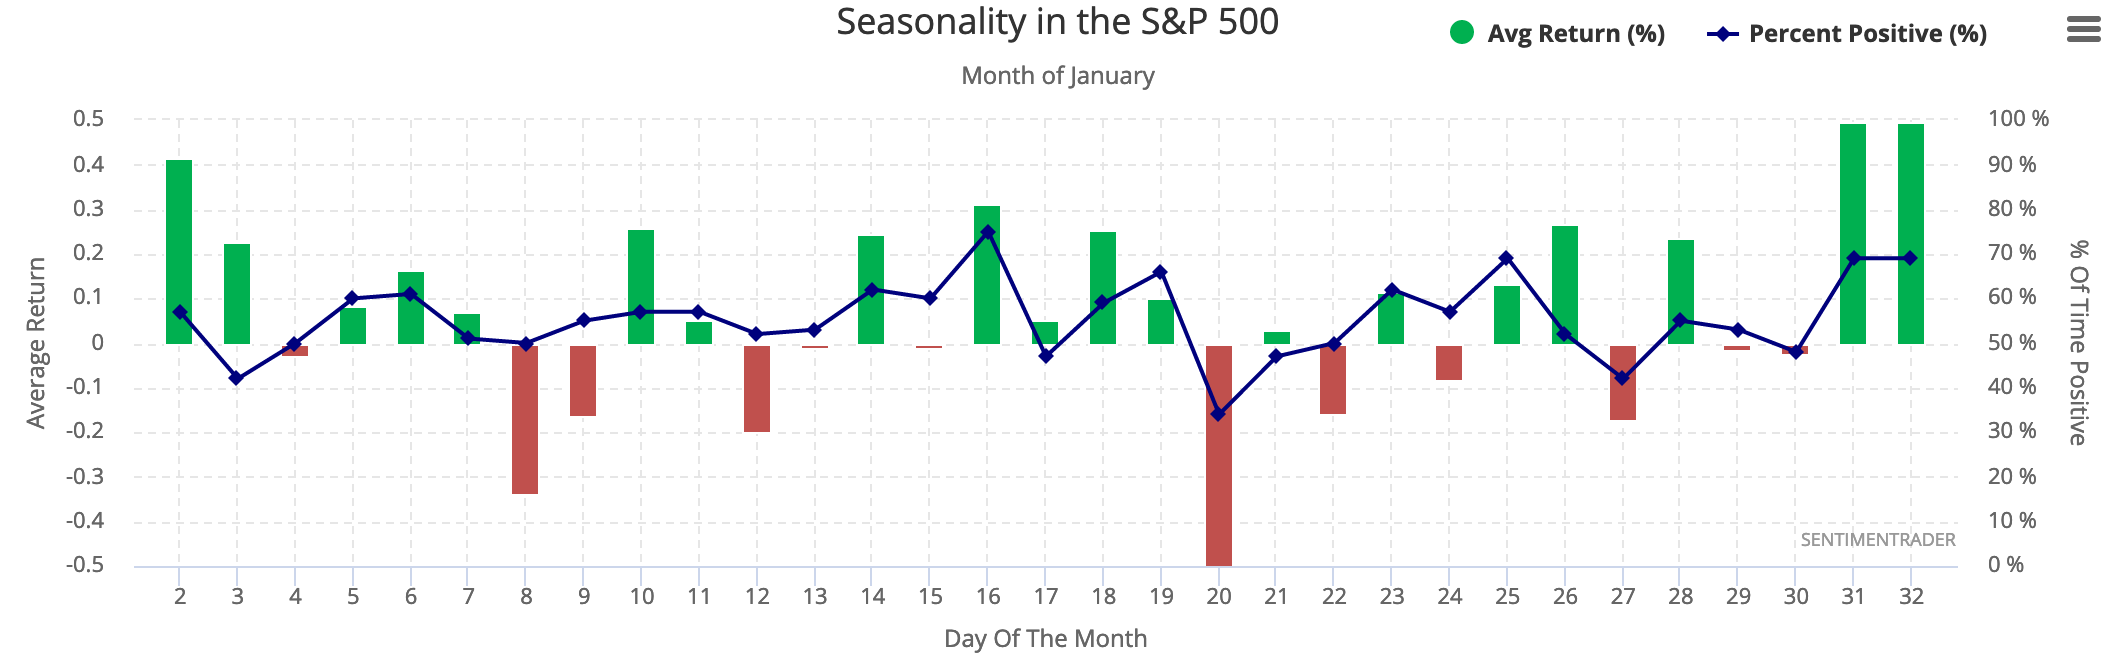
February keeps us good and bullishly lathered before it stops the bus and ends the party.
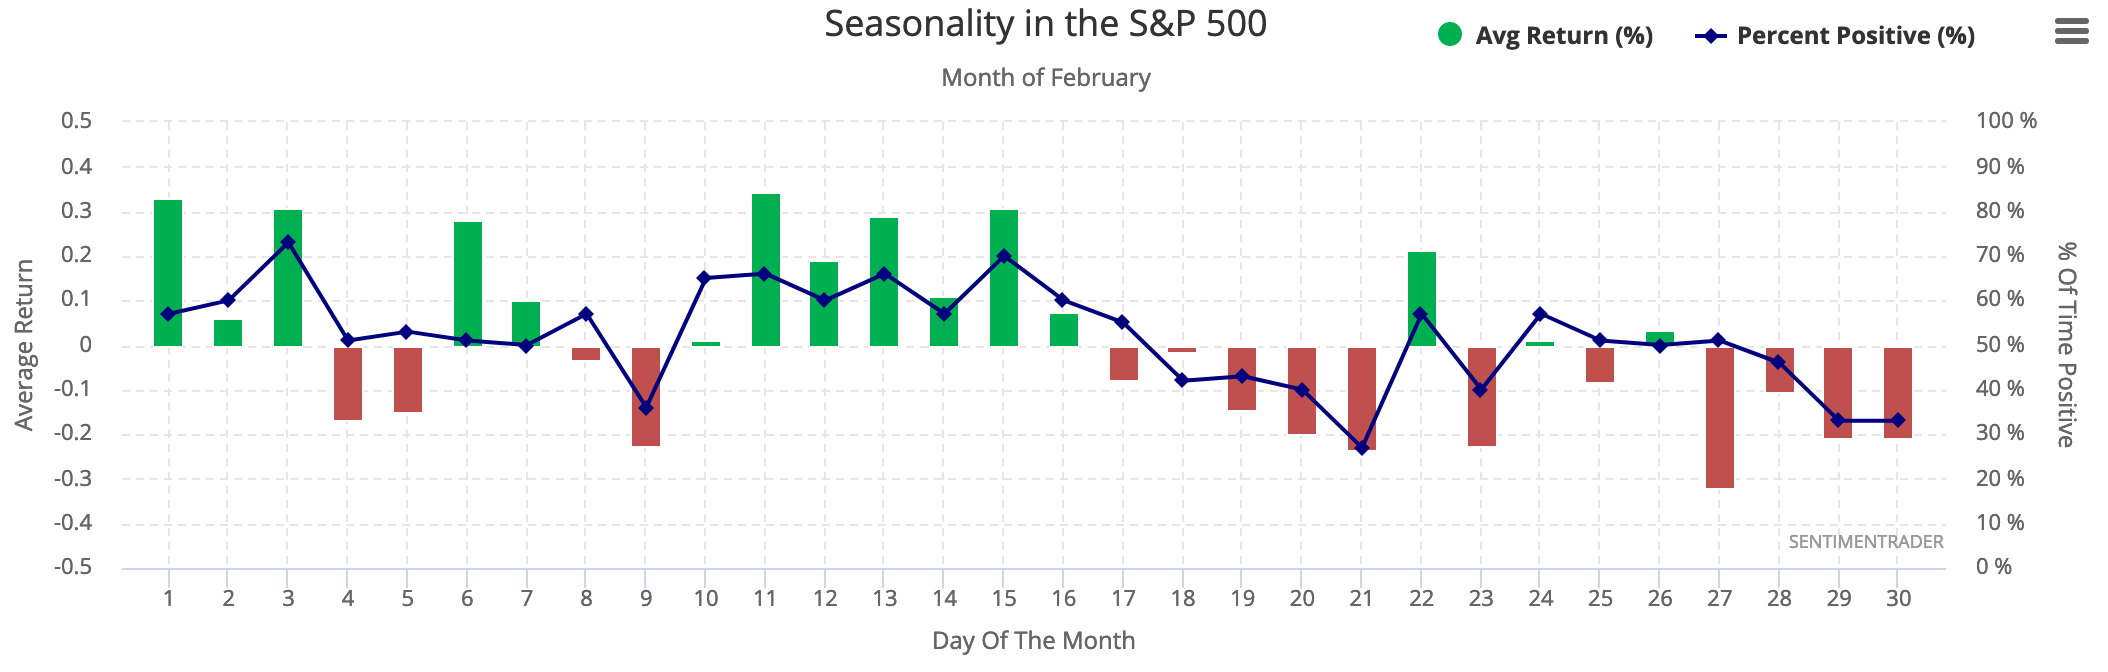
Again, it’s a guide. It’s a ‘quant’ on the market’s history. But these averages should not be taken as overly serious current market analysis. It’s one consideration among many.
Bottom Line
This week’s chop is normal to the seasonal averages. If the historical map proves near accurate, a buying opportunity may be shaping up in some disparate areas (growth stocks, commodities, small caps, maybe even the precious metals if they pull back appreciably). My tack this week has been to take profits, limit losses and raise cash in anticipation.
Graphs from Sentimentrader