A snapshot of this morning’s silver price futures.
The 18.90 area has been tested as resistance 4 times previously. The old saying in TA is that the more times resistance is tested the weaker it tends to become. Daily silver is not overbought and has a chance to break through. There is another resistance point at around 19.70, but as the weekly chart below shows, it does not look too formidable.

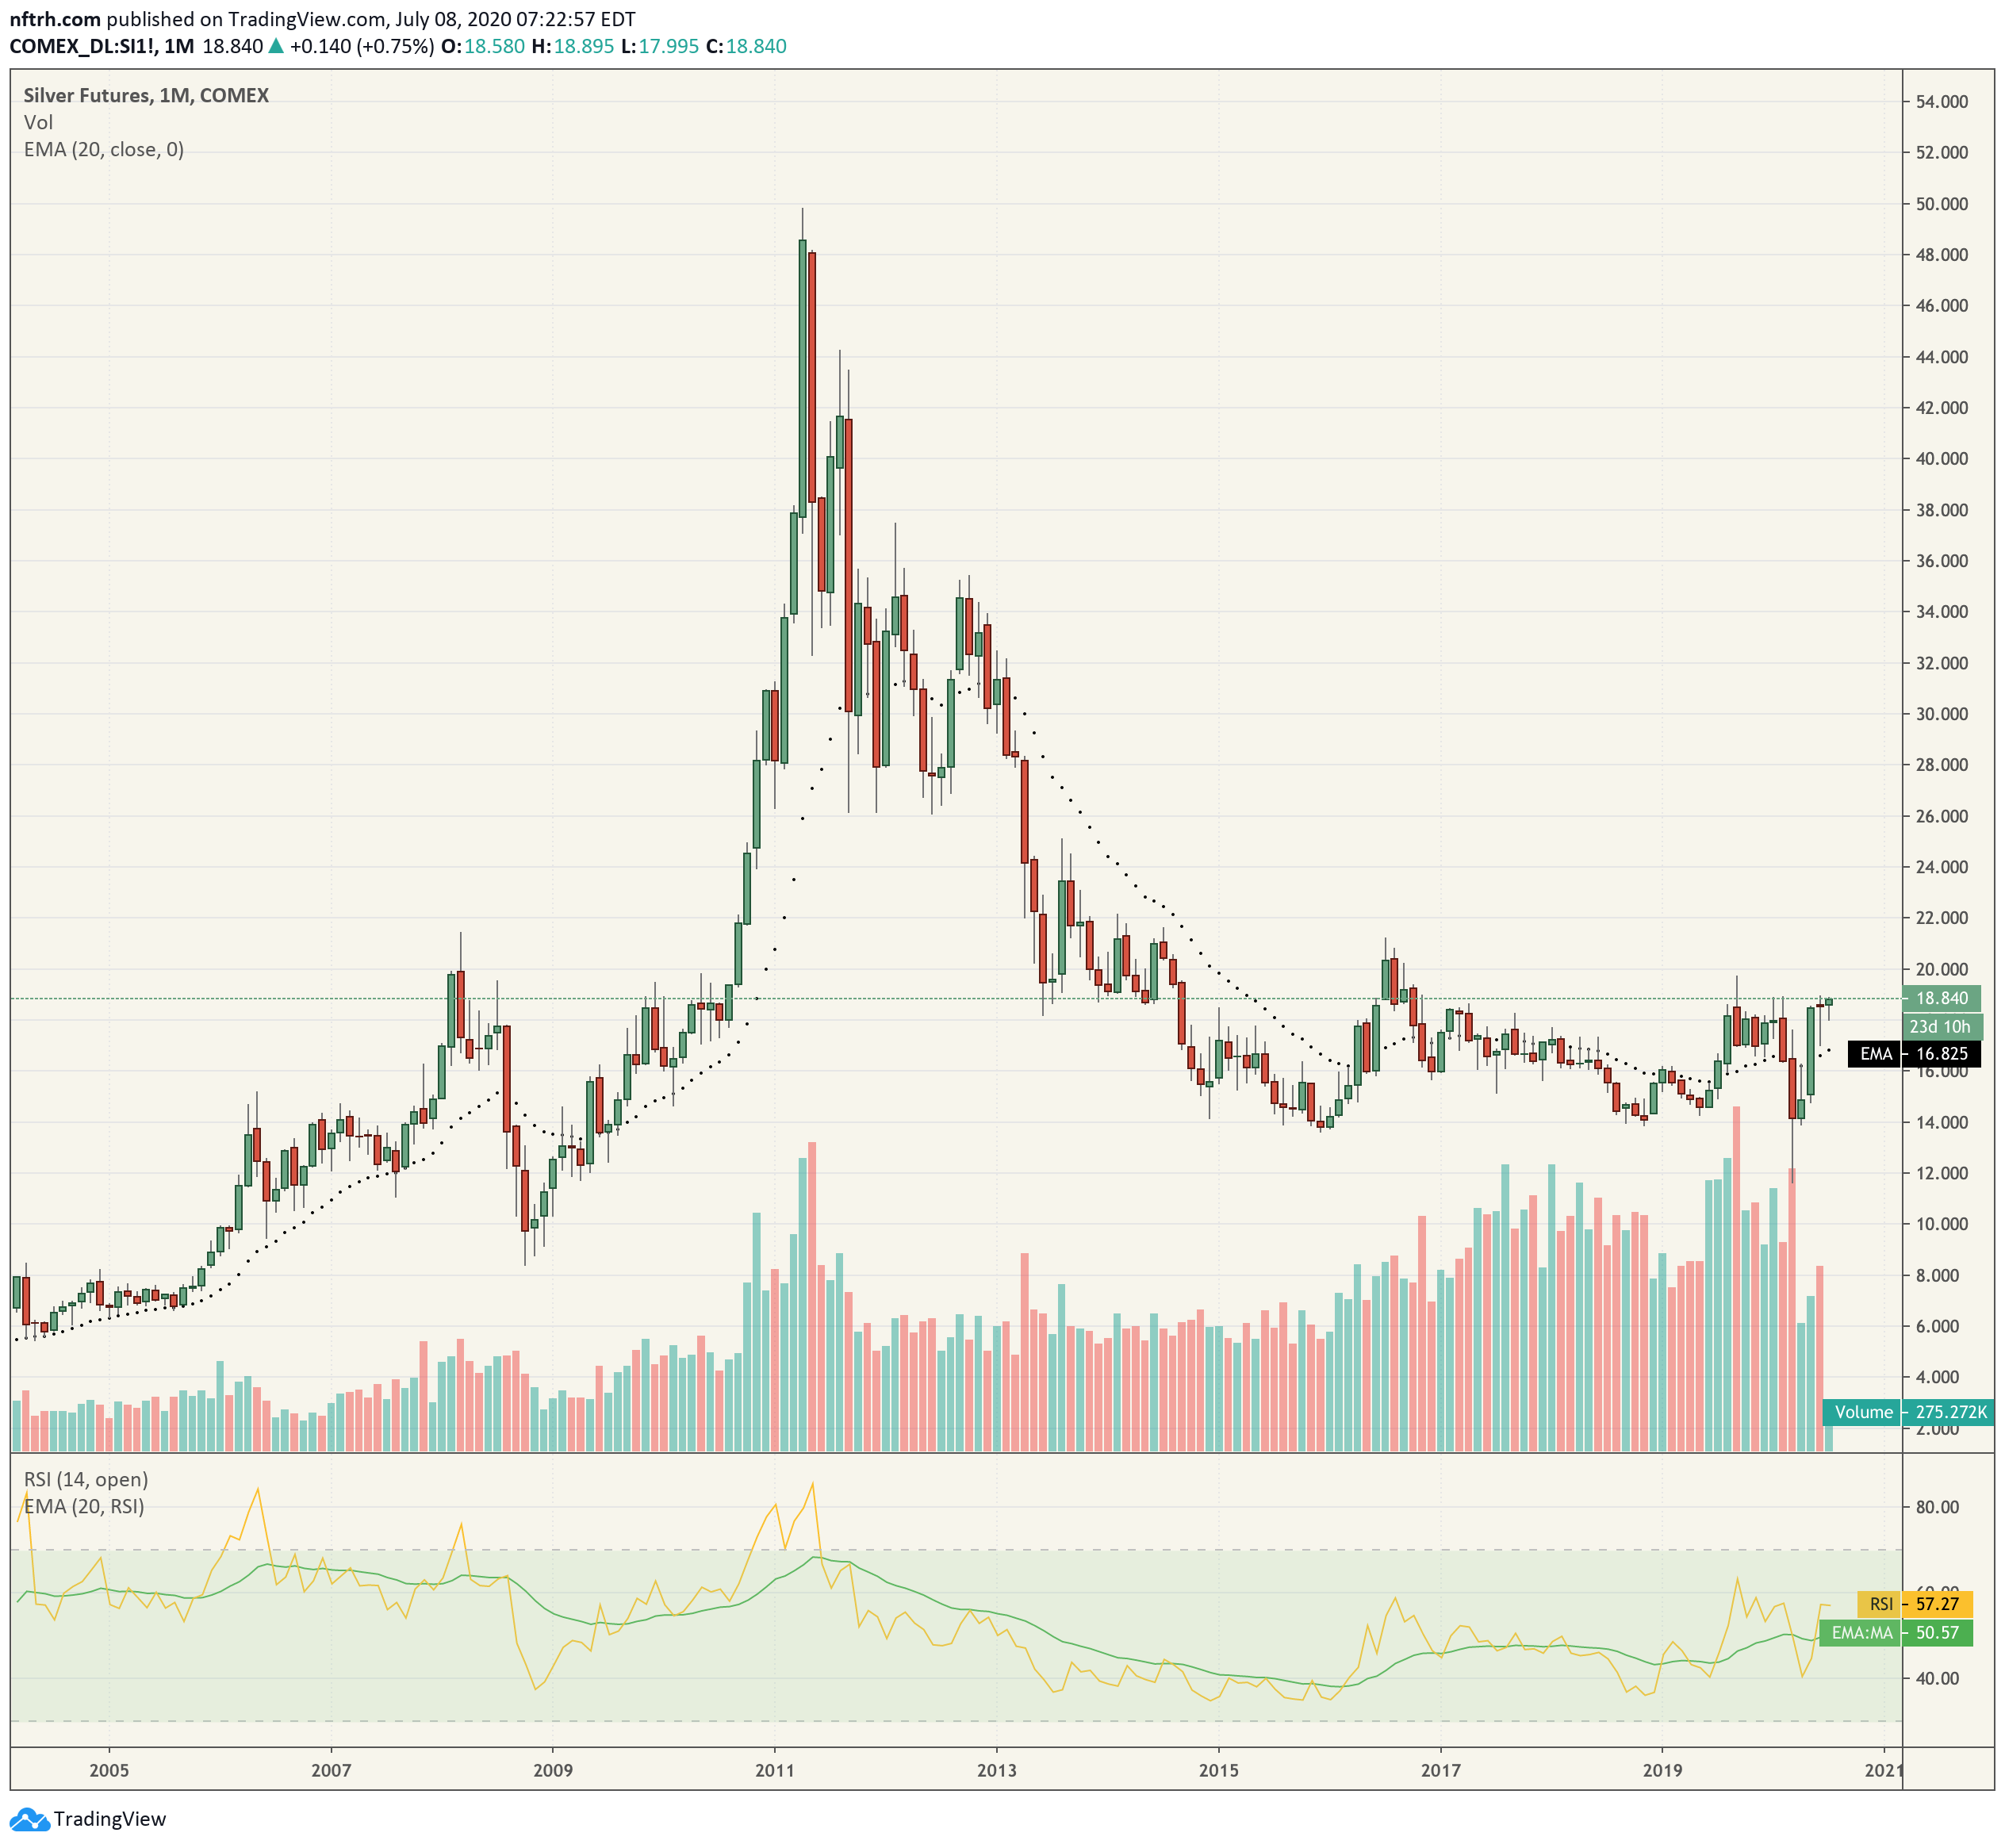
The resistance at 19.70 is minor because it just does not have much in the way of historical touch points. Silver is in a pattern that would theoretically measure to 24 (conservative) or 26 (not conservative) if it takes out these resistance levels and proves bullish.
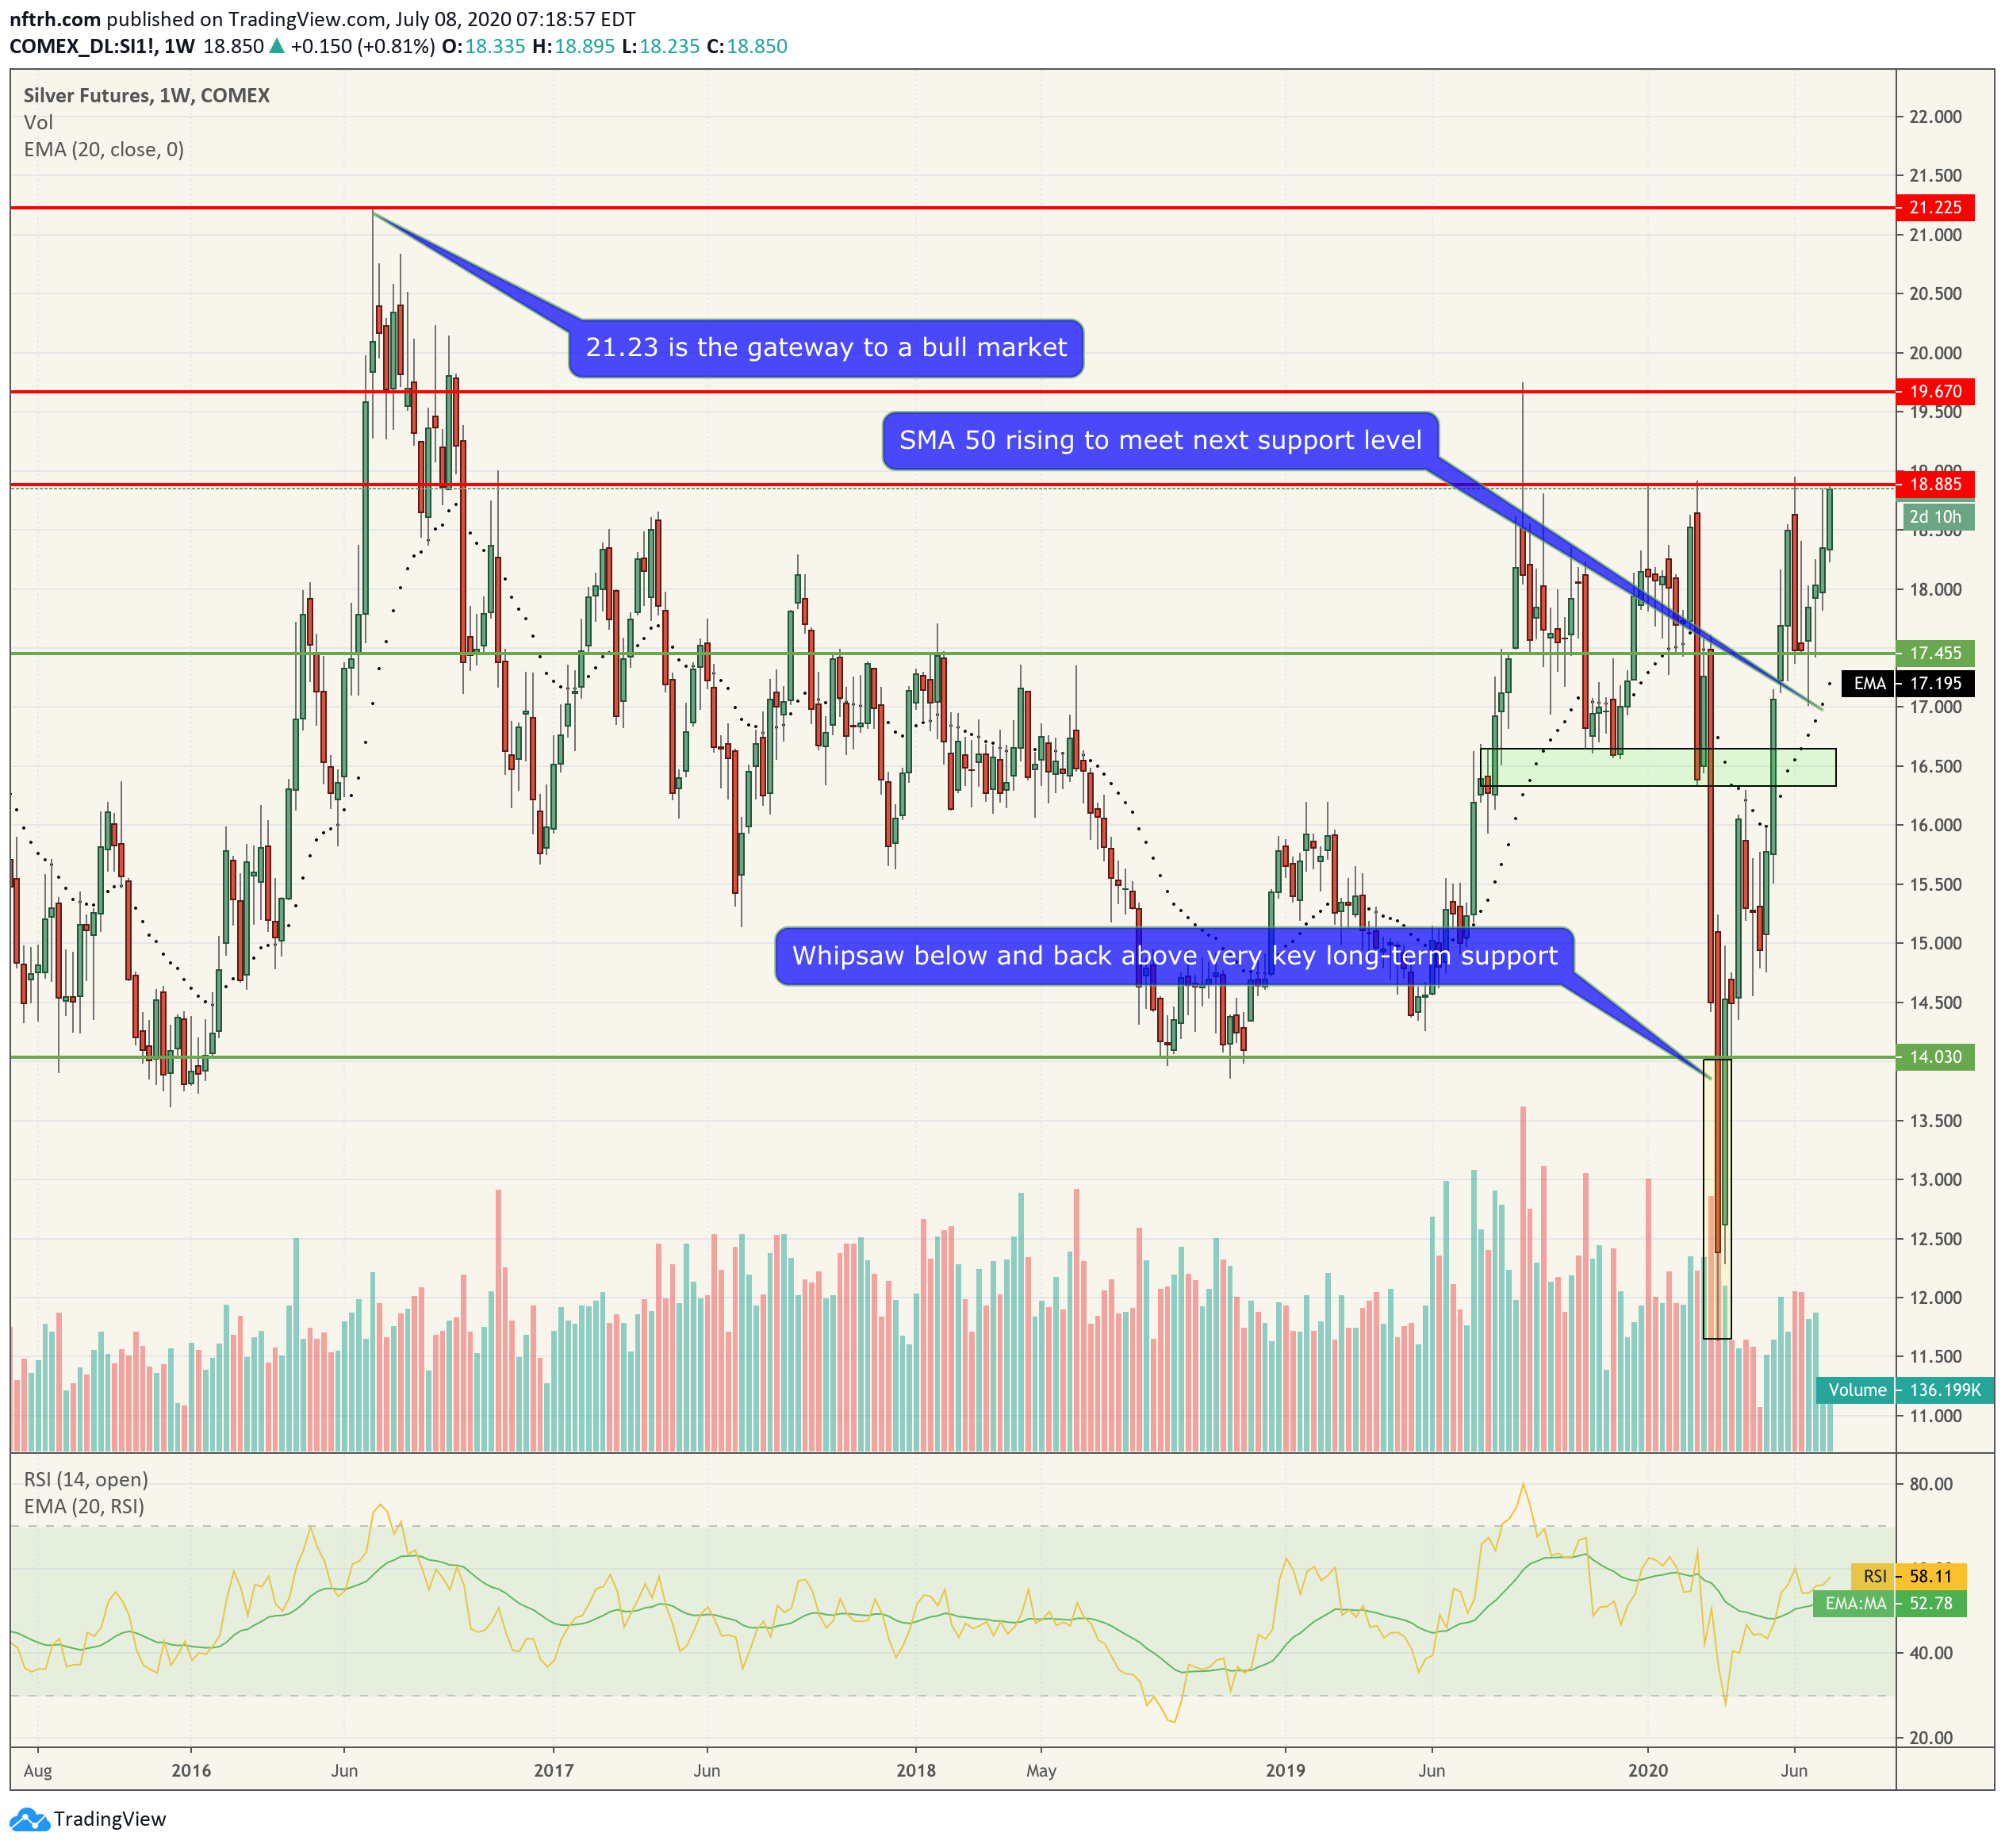
And that lines up with our initial would-be target for silver, which is 26 (as the resistance touch points from 2011 and 2012 come into play in the 26-28 range), assuming a cyclical bull market is activated above 21.23 (2016 high). It is very much like HUI and its initial target of 375.
As long as silver is below resistance, well, it is below resistance. But the odds seem pretty good that it can break through here. If it does, more attention will come to the silver market, which has been dismissed by many since the fallout from the 2011 bubble blow off.