The Silver/Gold ratio is still ramming upward along with its reflationary companion the CDNX/TSX ratio. We noted the near-term bullishness and the cautions therein in updates last week and in NFTRH 605.
But let’s take a look at nominal silver.
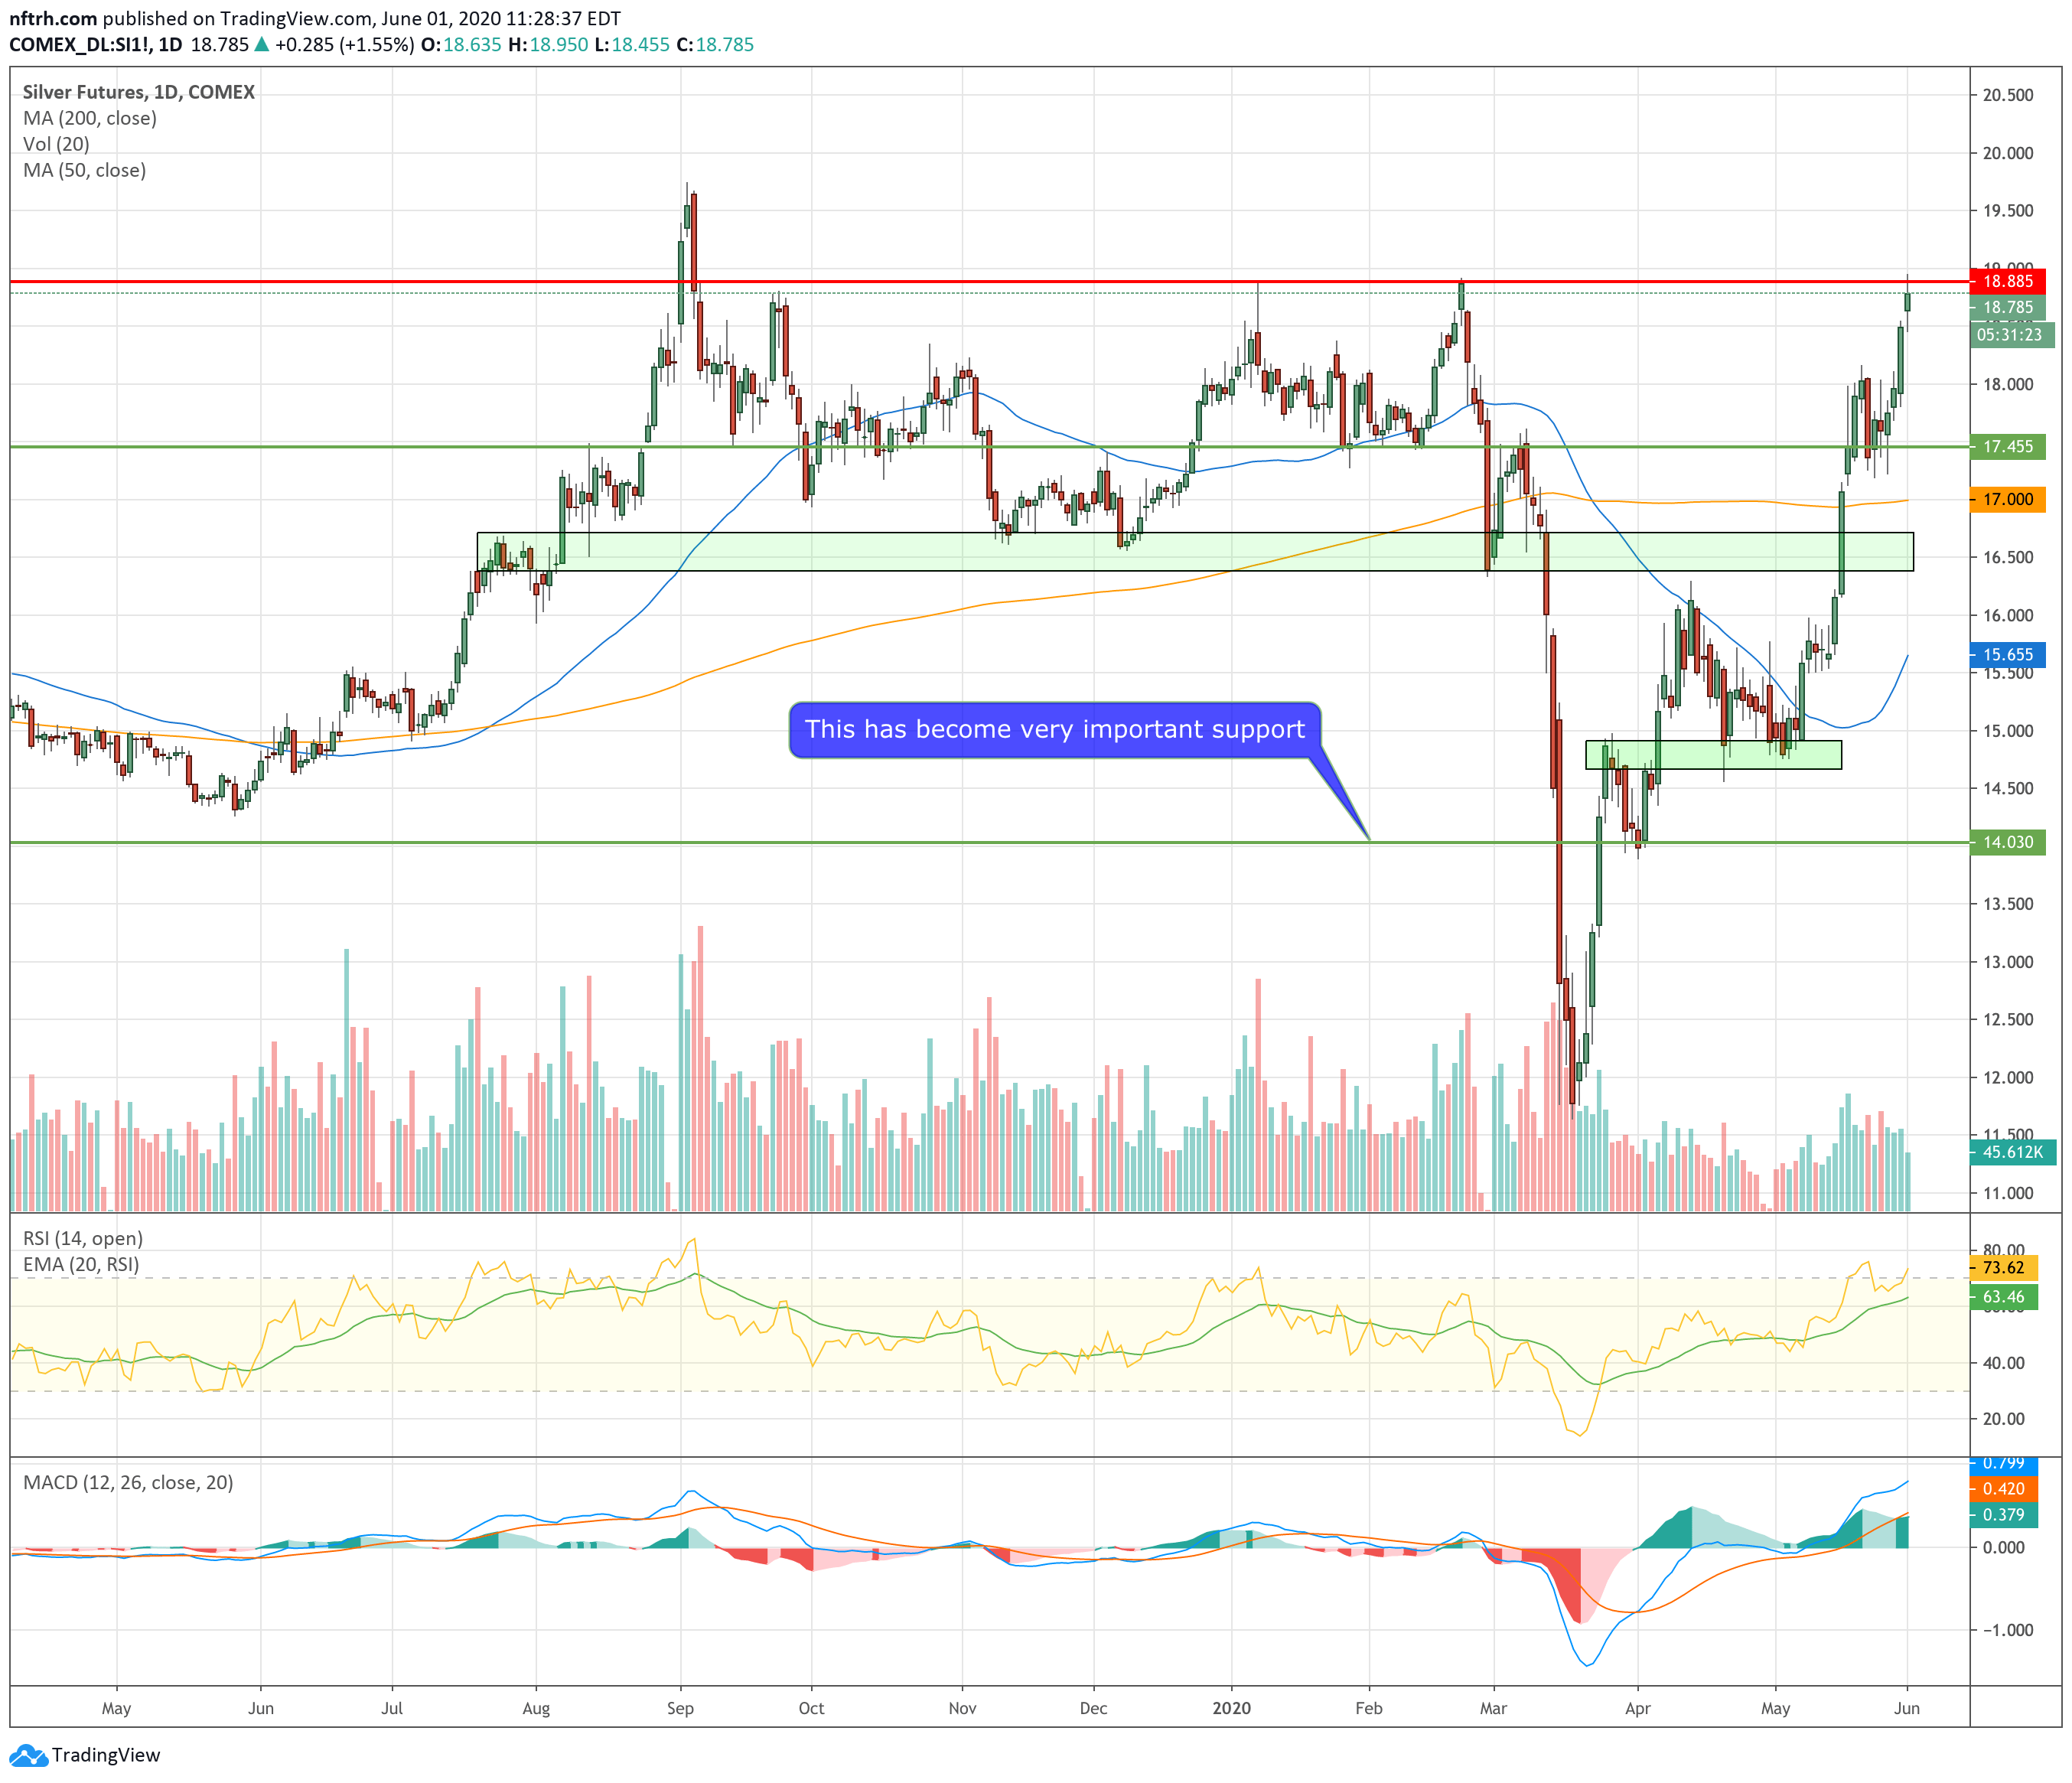
The daily chart shows that it has come to the level of the previous three highs around 18.90. Must it stop here? Well, it is silver and it could just as easily turn on the afterburners as reverse lower. The trends prior to the big dump in March were turning up. I think silver is making its move to reestablish those trends, regardless of any short-term volatility that is sure to come.
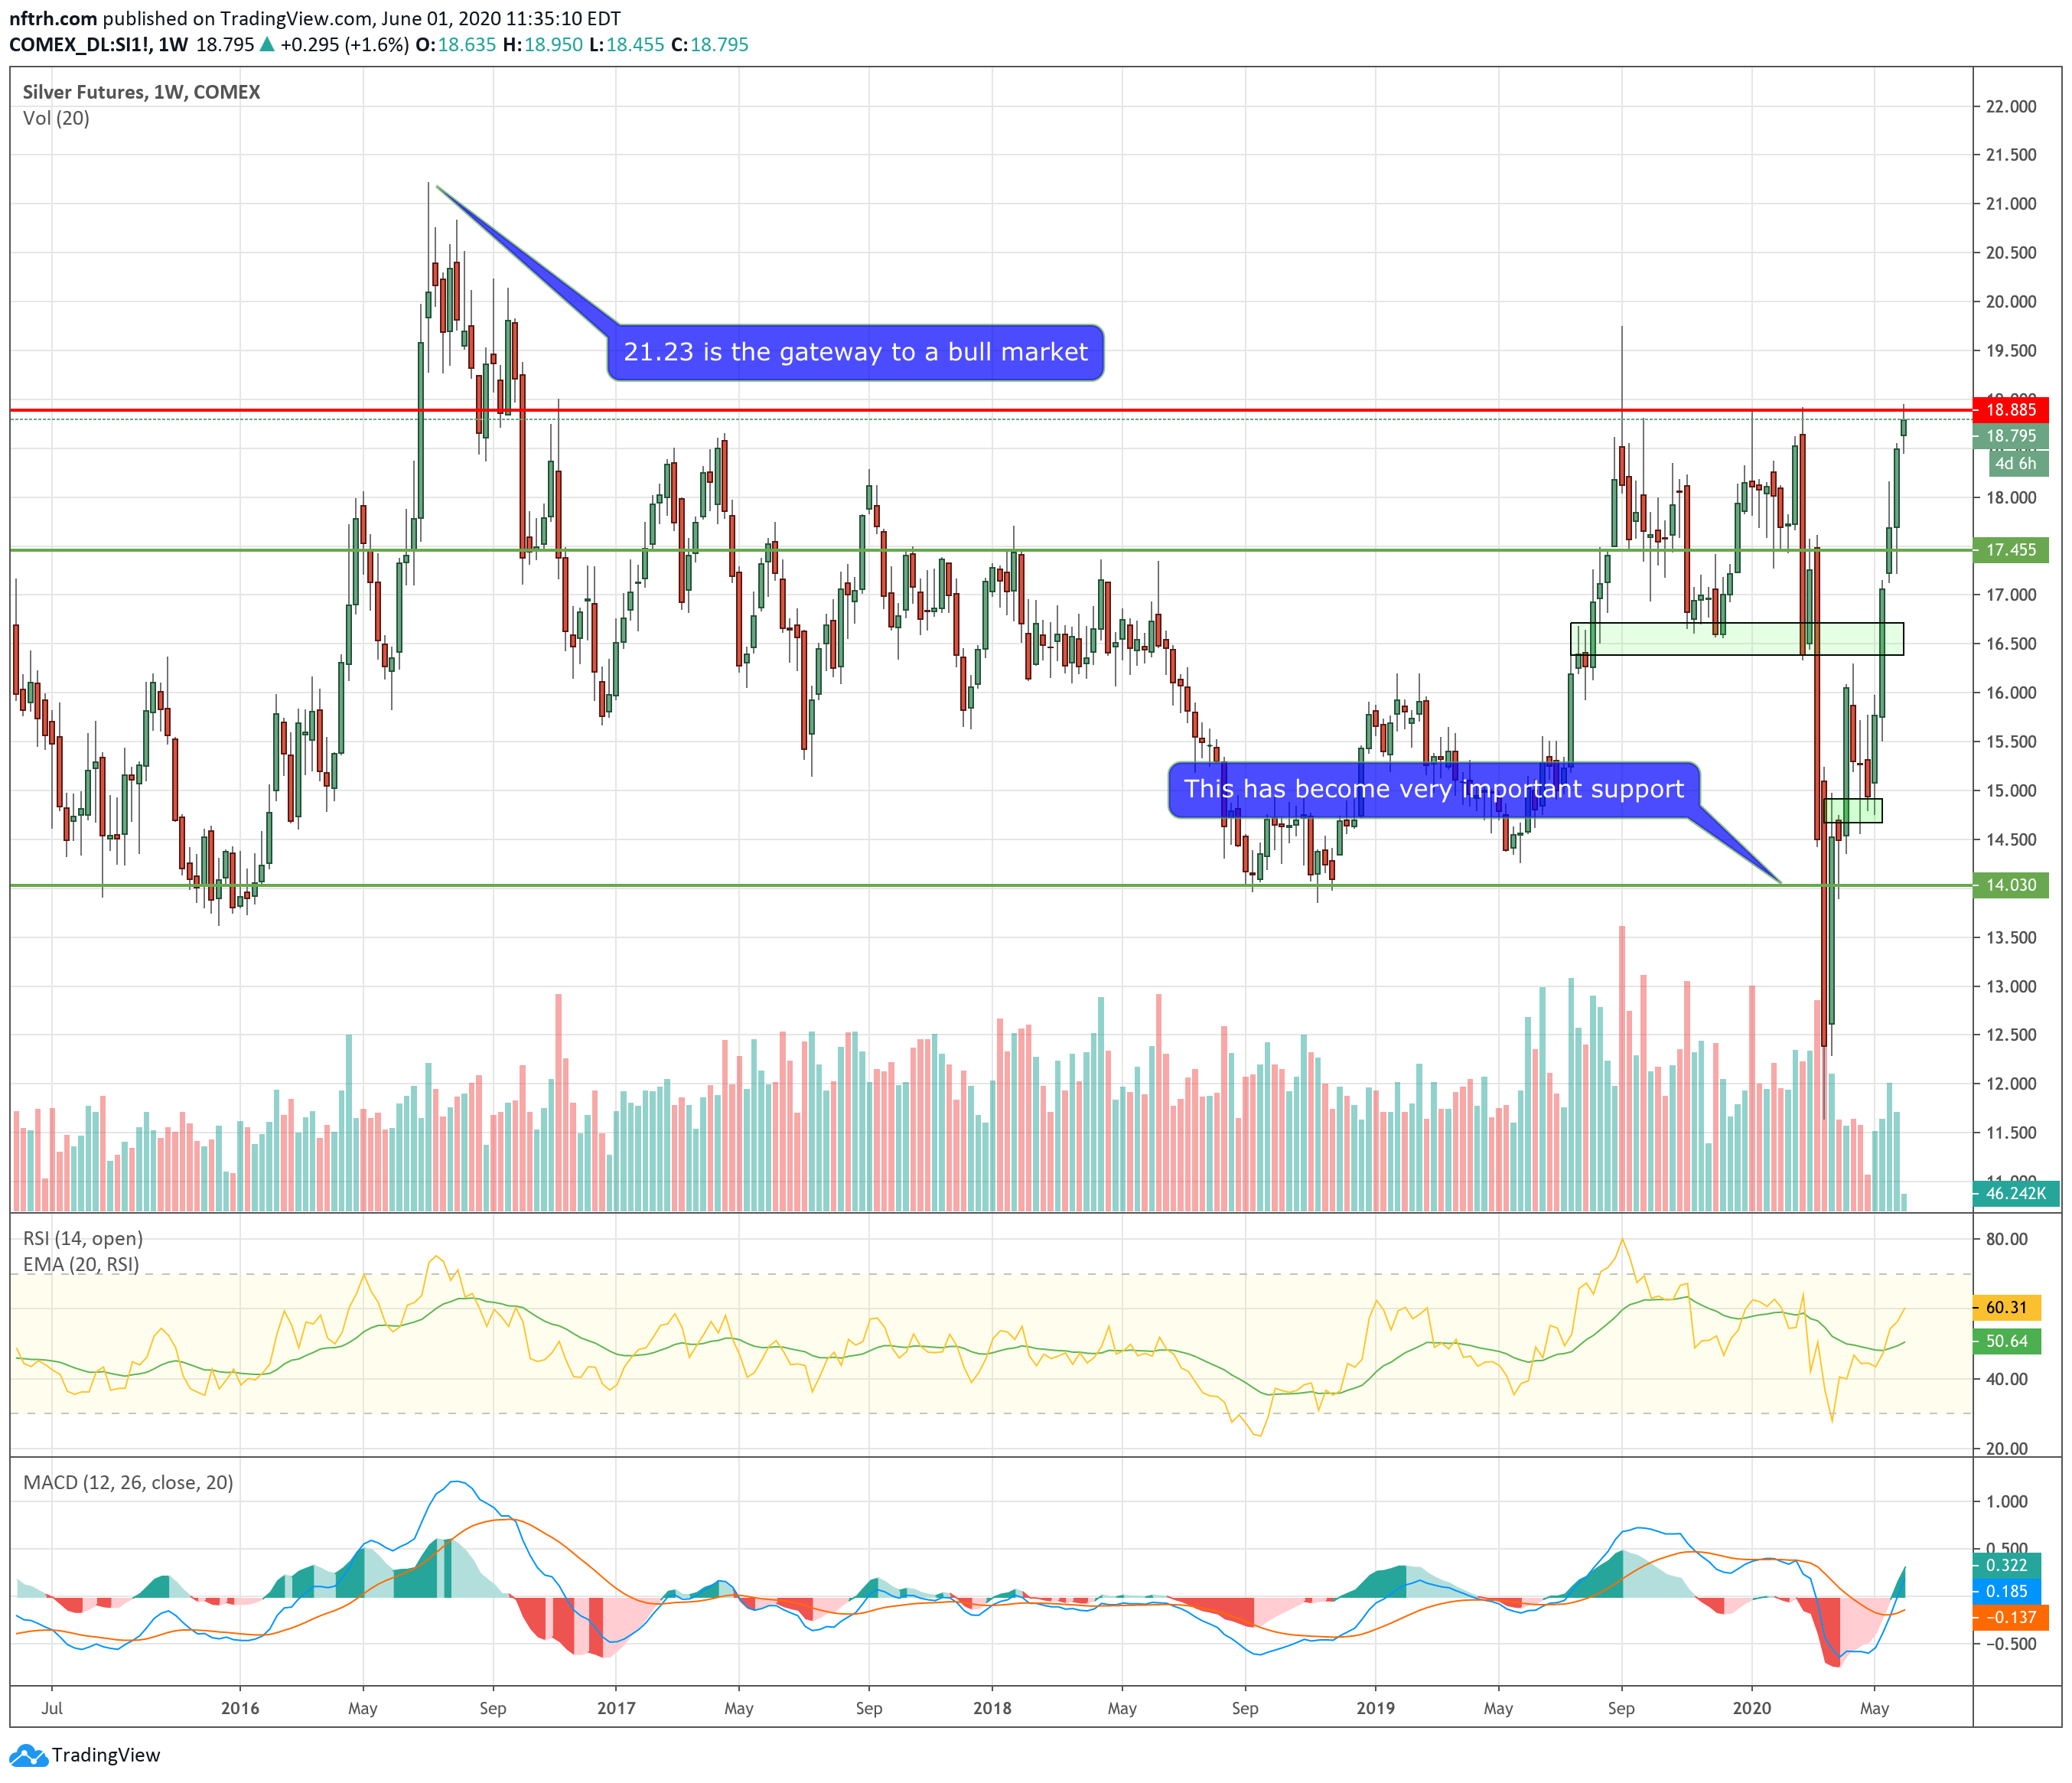
The weekly chart expands the view to show the 2016 high as the gateway to a new bull market. Not until that is taken out can silver be confirmed in a bull market.
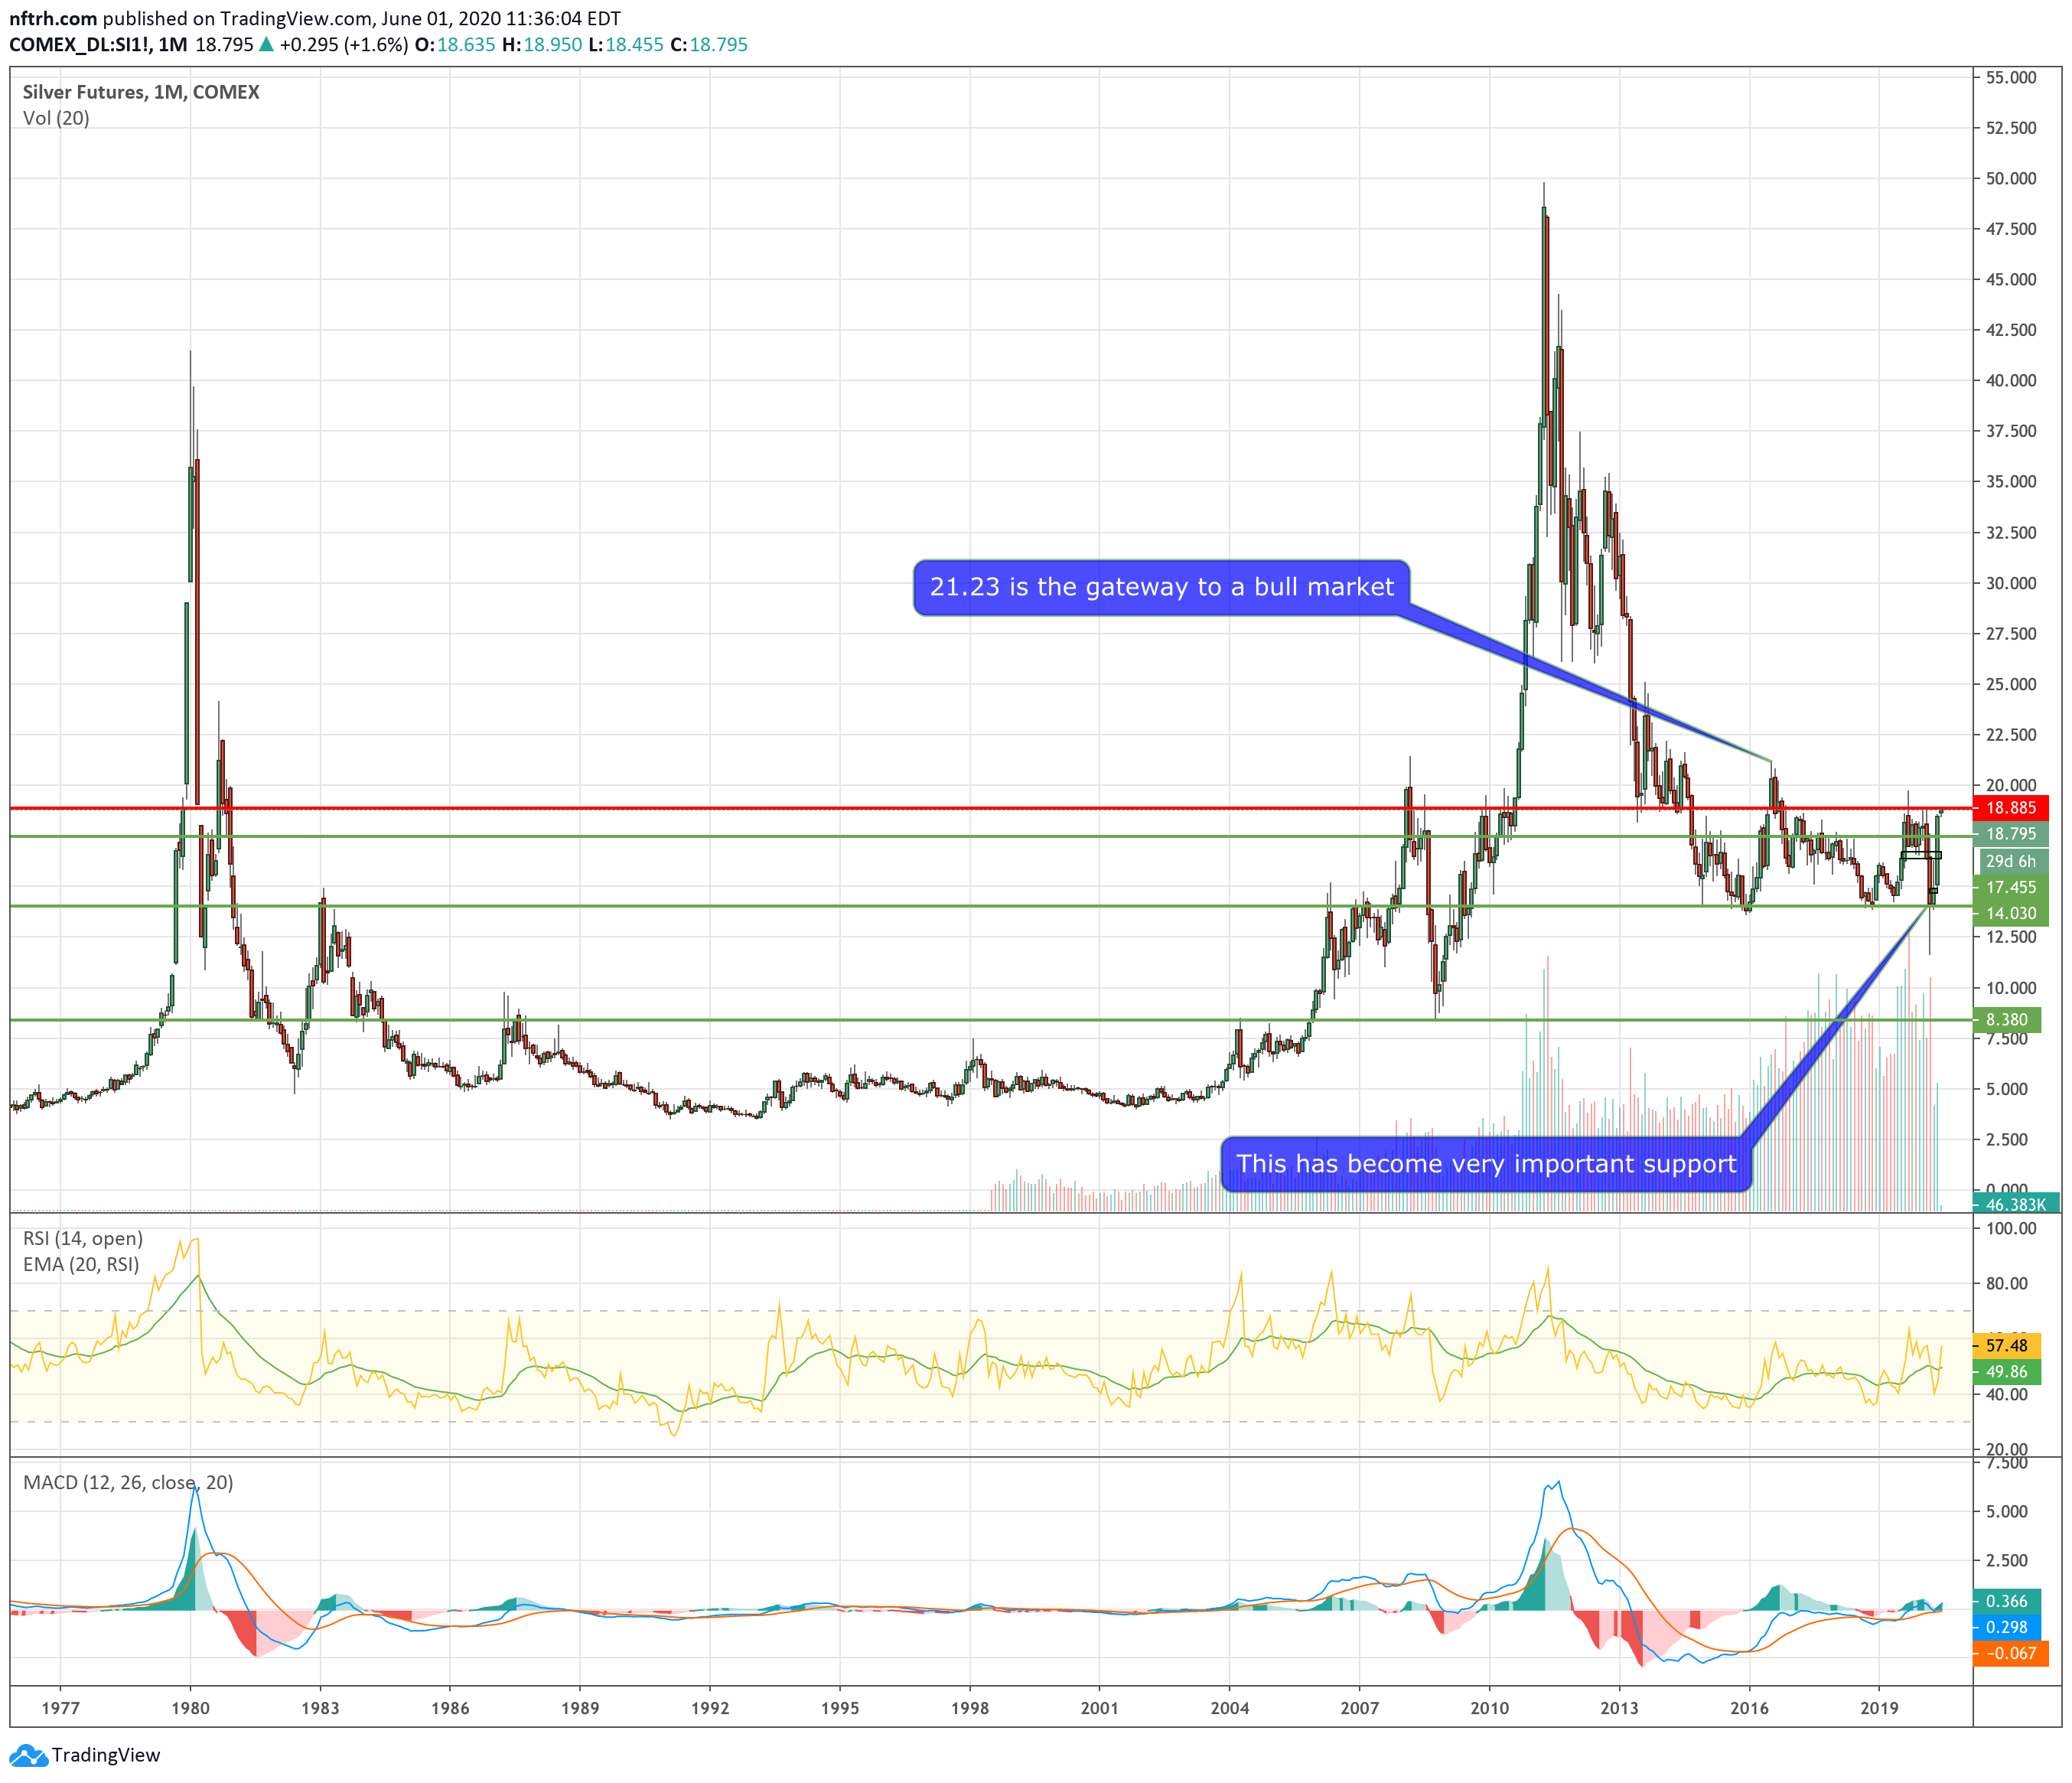
The monthly chart provides its usual big picture perspective. This is clear resistance here in and around 19. A breakout could turn it hysterically bullish. A reversal would send it on a support testing mission (keep the daily SMA 200 at 17 in mind). Interestingly here, RSI is in positive territory above 50 and MACD is about to go full positive too.