I keep a list of Warren Buffett’s Berkshire Hathaway holdings for reference. I’d already long-since bought IBM but was pleased to see it on the list. Current holding VRSN, which we’ve charted in the weekly report, is there too. It is not a legitimate investment strategy to simply be long what a legendary investor is long. But I’ve used it as a starting point for a couple of items. For the purposes of NFTRH+, if I also like the chart that is enough. Introducing Kidney Dialysis provider DaVita (DVA), another in a line of ‘boring’ companies I’ve become interested in lately.
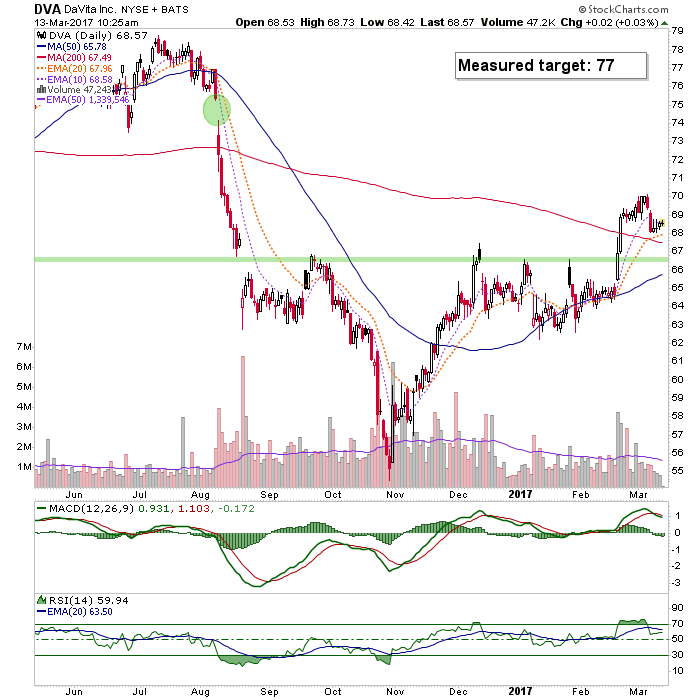
On the daily chart we see clear support around 66.50, which is also the neckline to a bullish looking pattern measuring to 77 or so. Conveniently, there also happens to be a gap up there waiting to be filled. DVA could be making a little bear flag currently but a test of the SMA 200 and/or the support line or even the rising SMA 50 could be a buying opportunity. I am a portfolio guy seeking balance (longs, shorts & cash) in a time of potential transition, so I may buy it before such a test. But a trader could try to be more miserly and wait for a prime entry.
The weekly chart shows the pattern very clearly.

Buy Target: 66.50 to 67.
Sell Target: 77 or anywhere lower that profit is acceptable.
Stop Loss: Below 64.50 to suit risk tolerance.
A reminder that chart based NFTRH+ updates are technical trade setup ideas, which may not be revisited as the buy, sell, stop parameters are already noted. They are meant as a starting point for further research if interested. I will not personally buy every item highlighted and will sometimes sell – without prior notice (because this takes time and resource away from NFTRH’s main functions) – any item that I do buy, below target, which is something I often do as a trader. Also please be aware that I am not a fundamental stock analyst. Due diligence is your responsibility.