Update sent to the entire list (as opposed to those opting in for NFTRH+ email delivery) because it is useful as a regular market update as well.
Note: A previous NFTRH+ update, ASHR is dropping below the tolerance point of 25. The technical reasons for the trade are being broken. But this appears due to political drama. I recall that this happened previously during my hold of India ETF INDA. I held through it and new highs came soon enough. As for ASHR, I am inclined not to get shaken out on political sabre rattling, but I will not have indefinite patience either. Again, as it stands now the technical reason for the trade has been broken, at least temporarily.
I found a nice looking chart and as it happens, it belongs to the Invesco PowerShares S&P 500 ‘low volatility’ Portfolio (SPLV). Here is its current composition (click here to research more fully if interested).

As for the chart, it has broken out of a downtrend line and using 41.25 as the breakout point, it would measure to a marginal new high if the breakout holds.
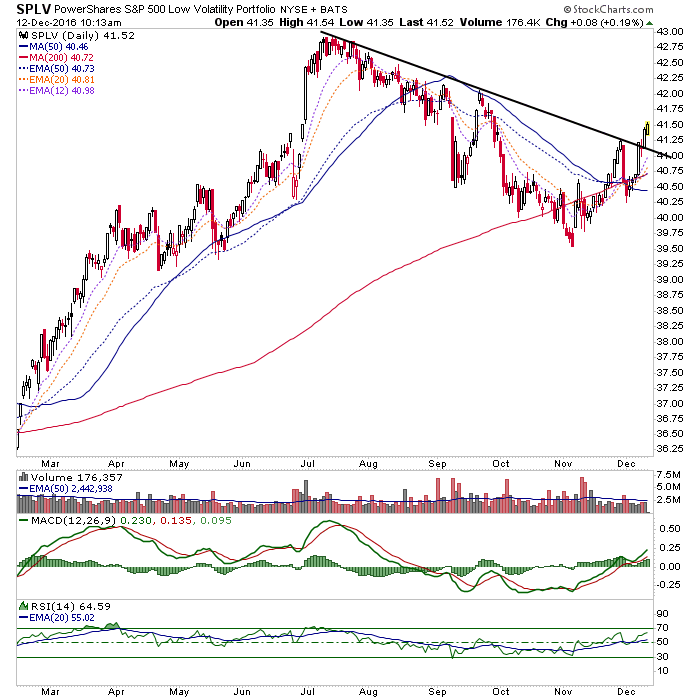
No formal buy, sell, stop parameters as this is not a dynamic situation. It is more of a defensive equities posture in a developing manic bullish atmosphere. Traders watch the breakout area and investors watch the the moving averages (a drop below 40.25 would not be desirable).
A reminder that chart based NFTRH+ updates are technical trade setup ideas, which may not be revisited as the buy, sell, stop parameters are already noted. They are meant as a starting point for further research if interested. I will not personally buy every item highlighted and will sometimes sell – without prior notice (because this takes time and resource away from NFTRH’s main functions) – any item that I do buy, below target, which is something I often do as a trader. Also please be aware that I am not a fundamental stock analyst. Due diligence is your responsibility.