In line with the scenario that sees greatly reduced risk in the precious metals sector and the bounce (at least) scenario we are currently managing, I thought I’d pop up the charts of various of my usual suspects. First I want to show the best chart arguing that the correction could already be over, since we have already reviewed reasons why the correction could extend further (HUI-Gold ratio’s 2001 ‘analog’, Commitments of Traders significantly improved but not at a completed trend, macro and sector fundamentals came under stress recently).
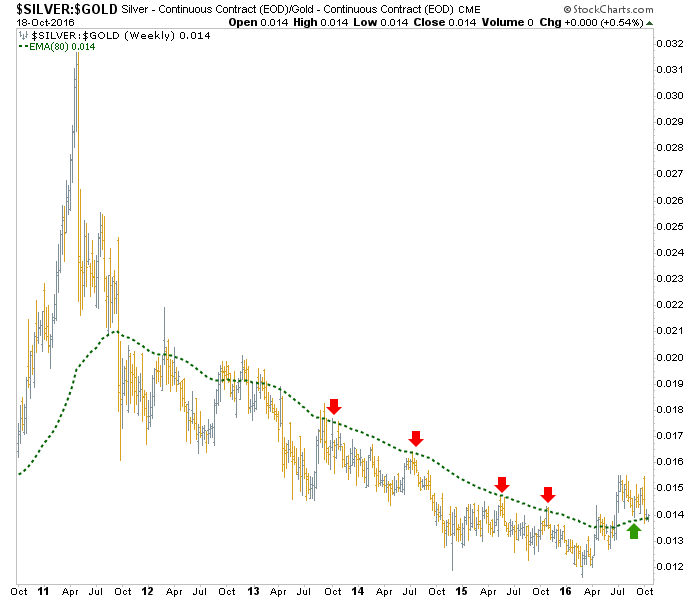
The Silver-Gold ratio will usually go in positive correlation with the precious metals sector and like the miners, the ratio has taken out most (if not all) of its risk, if it is to remain on a bull signal. It is either hold current levels or fail the signal (temporarily or otherwise). An indicator has not failed until it fails and this one is intact as of this writing, despite much corrective activity in the precious metals.
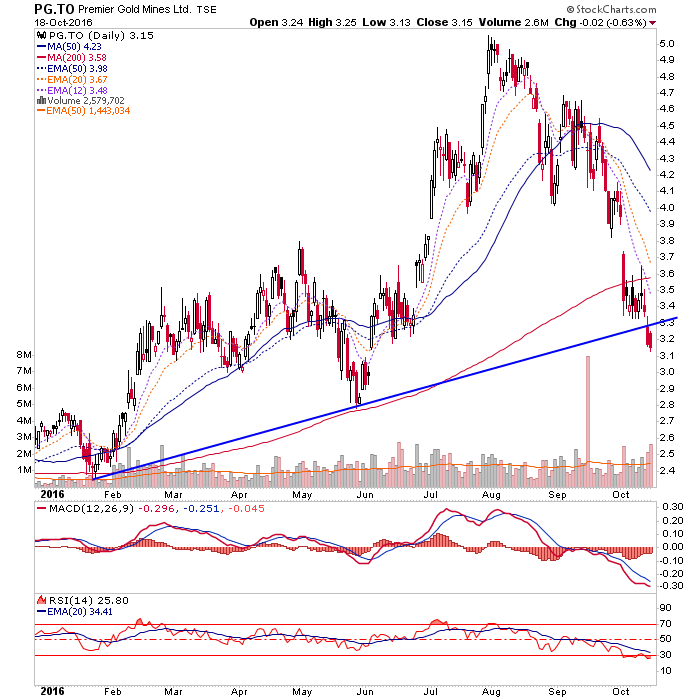
Starting with the ugliest and most over sold miner, PG.to/PIRGF has the look of something that goes beyond normal correction now. The H&S measures to roughly 3, so either PG is providing a great buying opportunity (I already own as much as I’d allocate to any single stock) or something at one of its varied interests (exploration, development & production) is not right. That something could well be the delayed Feasibility Study on its Trans Canada project. This is mining, after all.
So I want to use the above as an argument for people who do not want to do the work to keep up with individual company fundamentals (or pay a professional to do so) to consider the likes of GDX, GDXJ, GLDX, RING, etc. to take company-specific risk out of the equation. Sometimes I wish I’d do that more often (he says, recalling the SBB.to disappointment due to political risk).
On to more pleasant areas, we highlighted SAND as a ‘bounce’ buy last week in an update. This one is only on my radar (and currently in my IRA) because Mark Turner at IKN rescued it from the scrap heap and reclaimed it as a quality royalty company back at the beginning of the year. As SAND was inching to a trend line break last week we noted that 5.20 would be a reasonable bounce target. I also bought it that day. That is also the 38% Fib retrace level, as also noted. If SAND were to break above that and the now declining SMA 50 (solid blue line) we’d start the ‘correction over’ narrative.

Fellow royalty company FNV’s moment of truth comes into play at around 70. It is bouncing after getting over sold last week. I added this one as well.

Yet another royalty, SLW, is bouncing above support after also becoming over sold last week. 26+ looks like the bounce zone here. That is where the SMA 50 meets a visual resistance zone.

KLG.to/KGILF got murdered on its merger with NMI.to. I had written months ago that I’d like to see it in the 8 area. Well? Talk about de-risking; I feel pretty good holding this one for now after buying the tankage. 9.50 starts the bounce resistance area, should this thing decide to give its beleaguered investor base a break.

KLDX/KDX.to is a beast. I had hoped for a drop to the lower channel in order to buy more. No deal so far. If it breaks the channel it looks like it would fill the gap and who knows, maybe even tick new highs.

WDO.to/WDOFF is another strong one. I owe even knowing about this one to IKN, which made a great call on it in August. After being driven half insane by the stock (it looked like it was crashing at the end of August) it exploded upward, I sold too soon and then lived with my regret. Having left it on radar I bought back the recent hard drop. It is in a bull flag posture and I wouldn’t see a drop back to the bottom of the flag unless something goes wrong at the company or the sector fails to bounce. All things being equal, I’d probably want to add a pullback toward the 50 day averages.

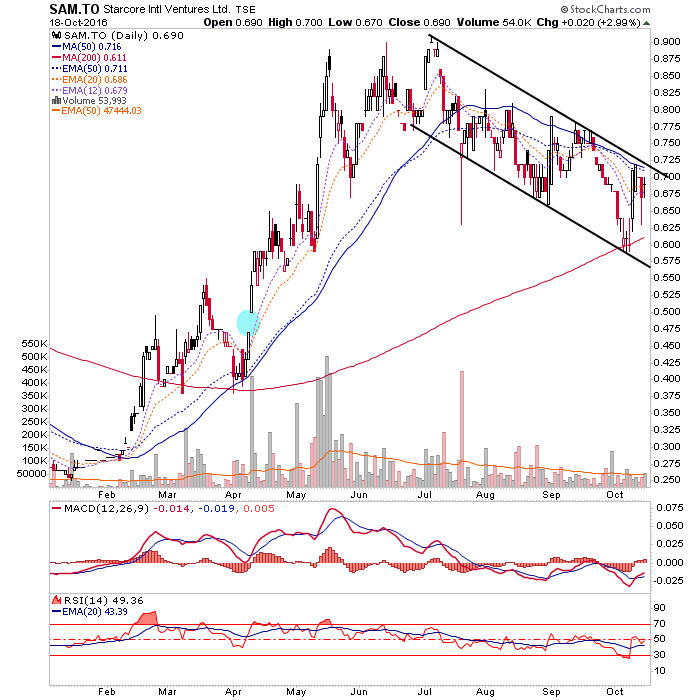
A top pick at IKN, SAM.to is one I have held all through its downward consolidation. It remains below the 50 day averages, but has tested the SMA 200 and a break above the trend line could actually see new highs. But (and there is always a “but” in financial markets) there is a gap well lower, for future reference. Also, it’s a thinly traded stock, so have moderation. This one has, in essence, lulled me to sleep. Not always a bad thing.
There are others that I hold, like DNA.to, SMD.V/SMDZF (formerly promoted by Bob Moriarty, on which I waited for the hype to die out before buying, as previously noted) and others I have held and will likely again hold, like SSRI, BTG, AAU, RGLD, NGD. Still others would be new to me, like EXN.to (a recent IKN highlight), which I am watching.
But the above should not only give a good picture on the near-term situation for these stocks but also help define the sector in general, when also using the HUI daily chart from yesterday’s update. Some usual TA sources who manage this sector for enthralled gold bugs and their bated breath, are beating the ‘correction over’ drum, enticing the gold bug herd again; and that is not usually a good thing.
Why don’t we stay boring and stay with the ‘bounce’ theme and be open minded beyond that? Since the correction began we have called two previous bounces nearly to the day, and indeed, bounces were all they were before new lows came about. Risk of price percentage declines is greatly reduced, but a trend does not change until it changes.