For the die hard bugs among us who have been waiting for buying opportunities, we note that HUI hit and inched below 200 today. It is time to be watching for opportunities in quality items. Here are a few charts of what I consider quality, with some brief comments for each.
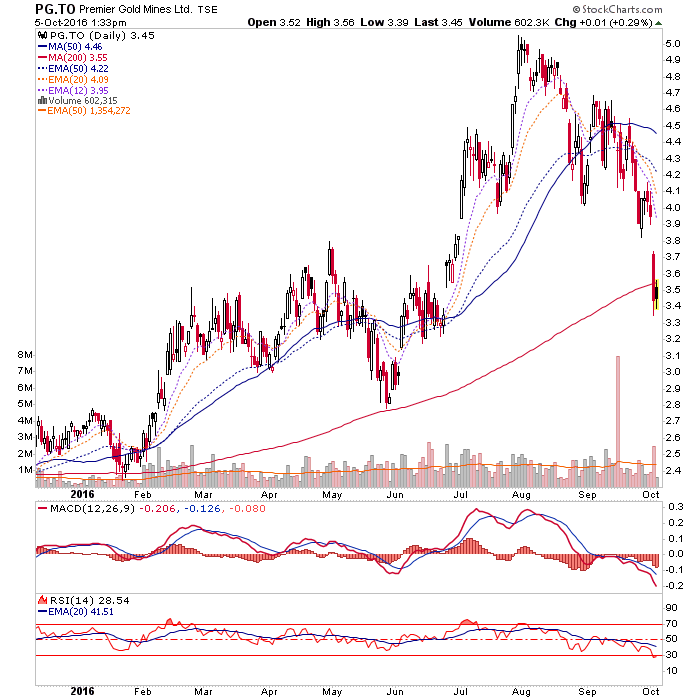
PG.to (PIRGF) got harpooned down to below the SMA 200. It is filling the late June gap with another one open from early June. People who want to invest in a situation like this might initiate a position with a plan to add if it drops lower.
KLG.to (KGILF) got destroyed on the combo of an acquisition of another miner and the sector washout. I had speculated many weeks ago that I’d like to see 8/share, but that it may not be in the cards. It was in the cards, and I bought it.

KLDX (KDX.to) took a hard break through the MA 50s. I have great difficulty seeing what could drive KLDX down to its SMA 200 with the rest of the sector, but I’ve seen stranger things. As it is, it appears to be making a try to fill the early August gap.

The three stocks above have been in bull markets since 2013, and I tend to think that is for a reason. Things can certainly get more over sold in the short-term, but assuming the sector is not cooked fundamentally (and you know that I do not make any such assumption, I go by the indicators) these levels appear to be attractive for people to initiate or add to positions (with the exception of KLDX, technically speaking, which again may simply be owing to it being a company of relative quality).
Now I want to pop in a few Royalty companies, because if oil and commodities continue to out perform gold, assuming the backdrop is inflationary, we will likely favor these types of companies over meat and potatoes producers, which would see cost pressures on their operations.
FNV (FNV.to) has tanked to the SMA 200, on cue, filling a big gap to boot. This is where an investor who’s just gotta have this stock could initiate a position, but plan to save powder to add lower if it drops further.

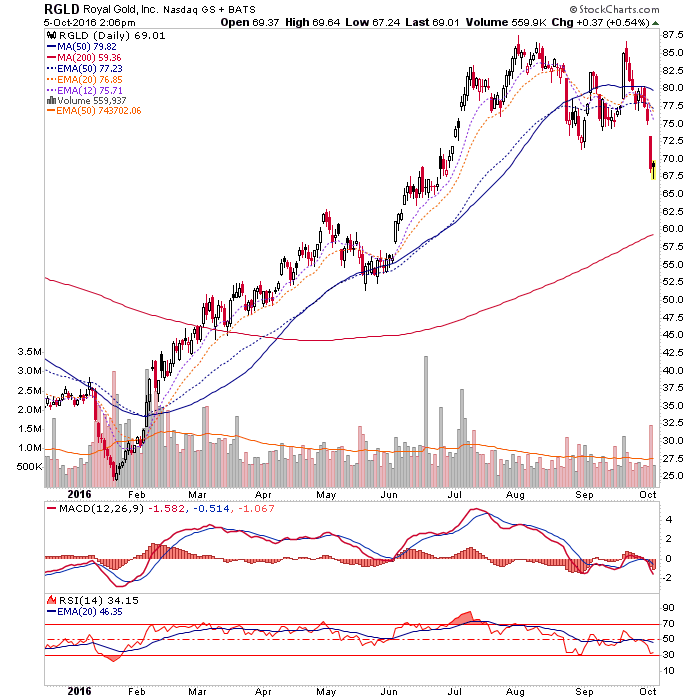
RGLD seems to have more room to the downside than some of the others. There is a gap way down below the SMA 200. What could drive it down there? Anybody?
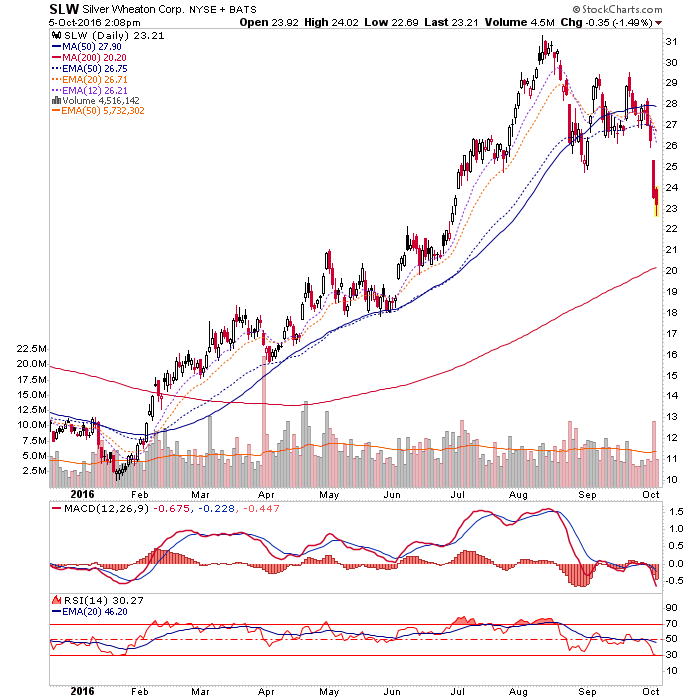
SLW (SLW.to) has taken a good hammering as well, but like RGLD, has not neared the MA 200. Is quality (including KLDX above) out performing or more correction to go before the sector is fully cleaned? It’s a valid question to ask in order to stay balanced.
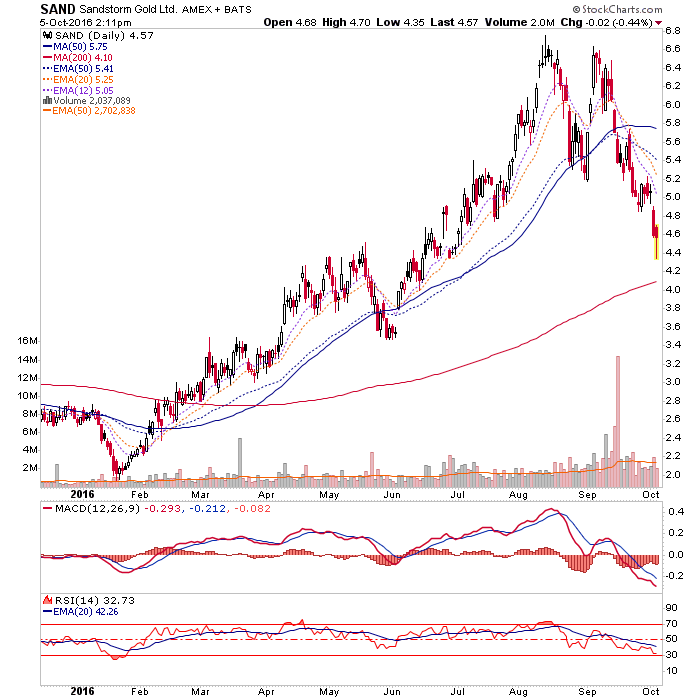
SAND (SSL.to) has done some great work but like some of the above, has not hit the SMA 200. Also, there is a gap way down in the mid 3’s.
Nothing goes in a straight line forever and we do have a scenario that could see an extended correction, time-wise, within which bounces and drops could take place. So if the sector rallies, there is always the chance that the ultimate lows could come later.
There is no exact bottom point to call in a disaster/opportunity (depending on your perspective) like this, where you buy and promptly laugh all the way to the bank. One thing is for sure though, in this sector you buy washouts, not the rallies (unless quickly trading). This has been a decent washout so far. A thorough cleansing? That may take longer. Still, I poked at one item but am keeping in comfort mode; i.e. no heroics for me just yet. The Royalty companies are of the greatest interest going forward with respect to this sector.