A calming update amid jumpy financial markets…
I want to put up a clear picture of HUI daily and use it as a potential road map, considering that things could jump around over the next week-plus. It is never as easy as ‘XYZ is bearish… sell! (or sell short)’. There are intervening ups and downs, and in case Huey gets an ‘up’ I want us to be able to be rational about it.
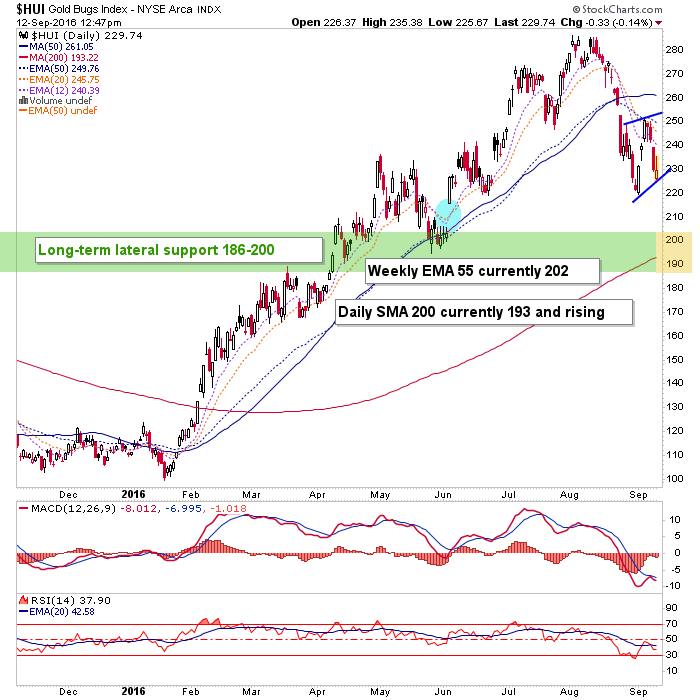
There is potential for another bounce up to the ‘bounce limit’ area at or below the SMA 50 (currently 261). In a news infested time frame like we have this week (lots of economic data and some Fed jawboning) and next (FOMC), things can get volatile (both ways). This chart gives some perspective on what constitutes a bounce vs. a rally resumption and once again shows us the major support confluence of the SMA 200 (193 and rising) and the weekly EMA 55 (202), along with long-term lateral support. The last 2 items are obviously not shown on this daily chart but are readily view-able on the weekly chart in NFTRH 412.
As for any bounce potential, that is all it would be until/unless is crosses the 50 day averages and holds above it. If that happens, great. But I would not get caught thinking any bullish price activity below that area is anything more than a market getting volatile and emotional in the midst of a heavy news cycle.