From NFTRH 346:
“It is possible that an A-B-C type correction began in March and ended in May and now a new bull leg has begun. But until 98 is crossed and held, that is just speculation.”
and…
“If USD resumes its correction, then we would be watching for a leg ‘C’ up in commodities (w/ silver leading gold) and a general ‘inflation trade’ resumption as speculated upon last week.”
Here is the daily chart at yesterday’s close. This morning the USD index has dropped to 94.81. It appears that the key resistance level has held.
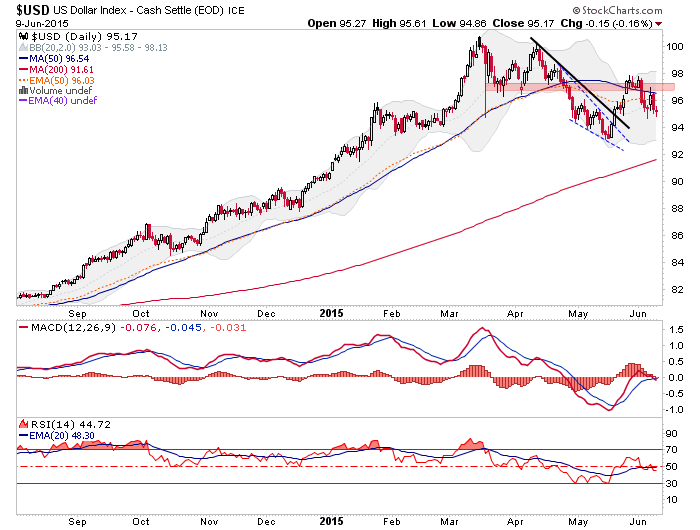
This does not mean that USD has to make a lower low to May but it does increase the odds that the SMA 200 (currently 91.61 and rising) will be hit. That area coincides with the first key support by longer-term charts and the 38% Fib retrace of the entire rally.

This morning gold and silver are rising along with crude oil, stock markets and a host of other items. As of yesterday the TIP-TLT ratio remained on its rally, and that continues to indicate the ‘inflation expectations’ story is still intact.
The Silver-Gold ratio (SGR) has declined over the last few weeks and is at a point where it can bounce. But importantly, the SGR remains well below major resistance.

Bottom Line
It appears that the ‘C’ leg up in commodities we have speculated about can take place, assuming the USD is going to drop further as indicated by the charts. Commodities would be a primary player in what we have been calling the ‘anti-USD trade’. Within this, other items like gold and various US and global stock markets can bounce as well.
But here let’s consider that the SGR, a ratio that would indicate a real inflation trade were it to break resistance, simply has room to bounce in conjunction with a would-be ‘C’ leg to the anti-USD trade.
So the point is to trade as traders will, but as originally projected for the commodity (etc.) bounce, it will probably have a shelf life. If USD comes to major support and an indicator like Silver-Gold to major resistance, it would be time for caution and at the very least letting the ‘inflation trade’ prove itself by breaking USD down and SGR up.
The bigger picture theme is for economic contraction, liquidity constraint and failing inflation. Think about the 3.6% to 3.7% target on the 30 year T bond yield. In fact, let’s add in this most important chart as another factor.

So the revised plan would be if USD comes to major support and an indicator like Silver-Gold to major resistance, it would be time for caution, especially if the 30 year yield has risen to the limiter, AKA the 100 EMA (currently 3.7%).