
On plan to the Continuum’s message…
The 30yr bond yield Continuum... continues As 30 and 10yr Treasury bond yields hold and amp up their recoveries by this daily chart... ...the big picture monthly 'Continuum' chart of…
Comments Off on On plan to the Continuum’s message…
October 20, 2021


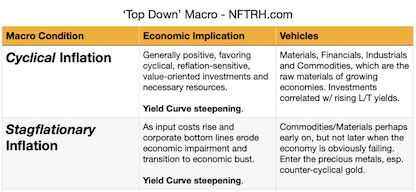


![Read more about the article When the tight economic rope slackens [w/ edit]](/wp-content/uploads/2021/09/stag2.png)