
Summary
- US Stock Market: Pullback in progress. This has come from an excessively over-bullish sentiment backdrop. Hence, the bear market rally could be over. Yet there is no technical indication of that.
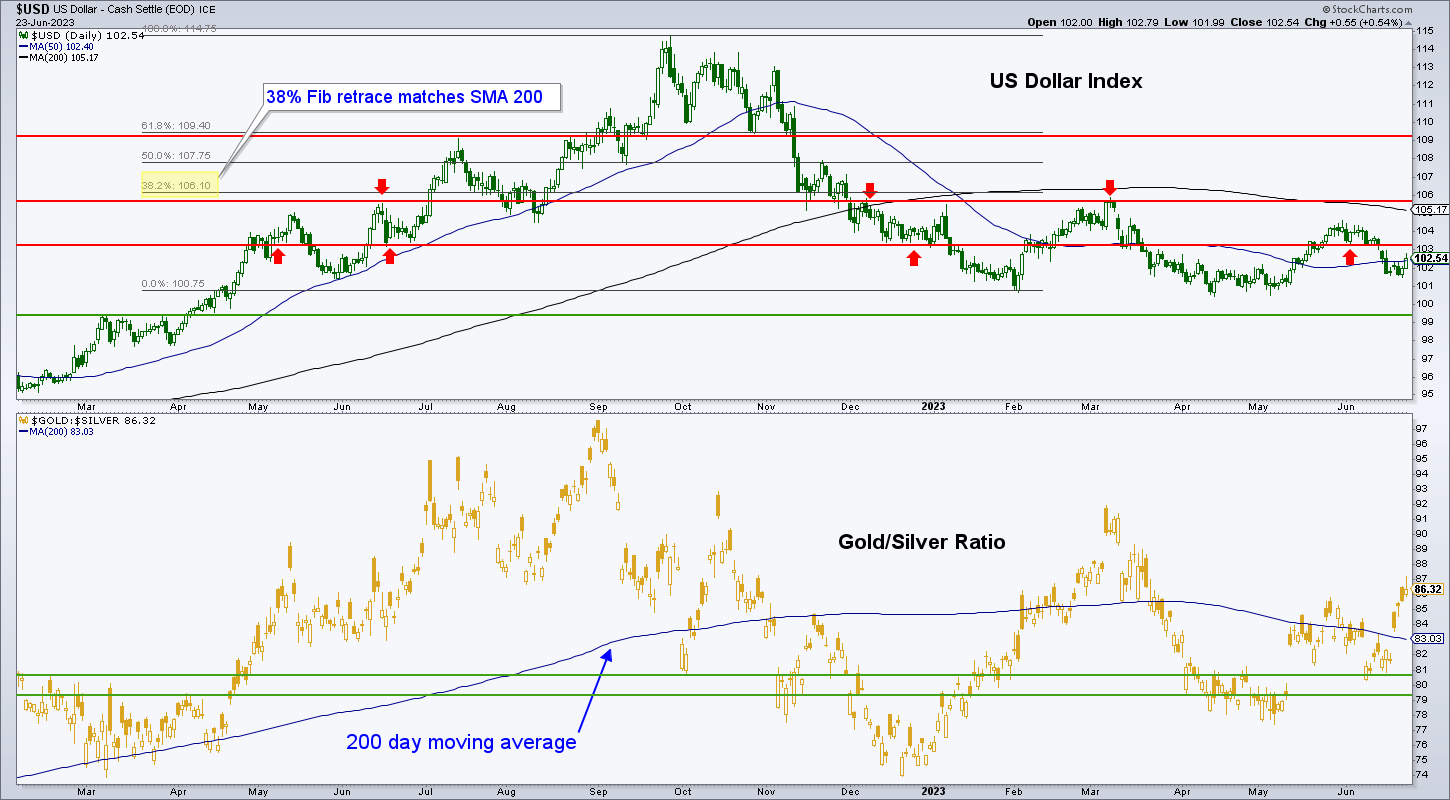
- Indicators: Speaking of indications, the Gold/Silver ratio popped last week and if it guides the USD upward the broad US/global rally could end sooner than the SPX 4800 target. Sometimes perceived technicals just don’t play out. Like, a lot of times. Other macro indicators continue to flash risk ‘on’, but by definition that risk is high. For just one example, the US 10yr-2yr yield curve. How much more flattening before the coming steepener?
- Market Sentiment (US), as per last week: When we began the rally theme way back in Q4, 2022 the aim was to build a pervasively over-bullish sentiment backdrop born of FOMO driven MOMO. Well? That is what is happening now. With extreme bullishness comes extreme sentiment risk, which will only increase if/as the market goes higher. Sentiment is not a timer, but over-bullish sentiment will be a condition of the next market top. This week: Despite the pullback in stocks, the week ended with the VIX buried under all that complacency. While Friday’s down day dinged sentiment just a bit, it is nowhere near the same zip code as contrary bullish. It remains a contrary bearish indicator in general.
- Global Markets: Many global markets took a hit last week. Some (e.g. Canada) breaking bearish and others (e.g. EM, Asia) breaking suspect and others (e.g. Europe) getting dinged within intact uptrends, like SPX in the US.
- Precious Metals: If our downside targets are good ones, then the risk/reward is improving nicely in the precious metals, as we generally look for higher lows to the March lows. In essence, the poor risk/reward in bullish asset markets is the same reason for the good risk/reward in the still correcting gold price. Patience.
- Commodities: Agricultural drove CRB up and both got slammed to end the week. Uranium went suspect, technically, as has copper and its industrial bros remain bearish. In Energy, WTI Oil is firmly bear trending while NatGas broke upward from its basing pattern. Interesting. On the whole, the commodity complex is trending down and bearish. It seems to be forecasting our favored macro outcome, which is disinflation morphing to a more pronounced deflationary episode before the next inflation trade. But we’ll keep an open mind about that each week until it either plays out or gets negated.
Hussman on Bubble Induced FOMO
I don’t often read John Hussman. Like, probably not for a decade or more. I think Hussman is a brilliant market observer and analyst, but I think he is not a good market manager (by definition of his good and forthright work). That is because we have had a bubble ongoing – with a few rude interruptions over the years – since probably the mid-late 1990s. A bubble in policy; funny munny policy. “Inflation onDemand”, as I used to call it years ago.
Not that I have been a gung ho successful market manager myself. As a risk manager, I would never leverage into a bubble. But the damn thing has been ongoing, eh? So forthright risk managers are going to under-perform all-in bubble participants, again, by definition, as long as said bubble persists.
This gets to the crux of our current macro theory (and right now it is still only a theory) that the “everything bubble” (EB) is ending (as signaled by the Continuum’s break upward through the limiters for the first time in decades). The 30yr Treasury yield is my beautiful (IMO) picture of a primary funding mechanism for the EB. In its void of inflation signaling, the Continuum has been a backbone against which the Fed has had license to inflate. Make sense? Now the trend is broken. Big time.

A post-bubble contraction (cue the Bob Hoye squirrel potentially and finally finding his ‘post-bubble’ nut) may be engaging. That would be the reason that I am bullish on gold mining; not because I like punishment, degradation, humiliation or several other aspects of being a committed gold stock bull over the last few decades. We are managing a post-bubble possibility, and the bears – those who’ve survived – need to hold onto the ball here during the bear market rally (which I have steadfastly called it since managing its beginning in Q4, 2022).
Before getting back to Hussman, let’s just note that the bubble is not officially indicated to be over as fiscal (government) policy is in play to varying degrees and in varying locations in the US and globally. In the US, it’s spend spend spend and oh yes, raise the debt ceiling in order to do so. Slight of hand. Bubble stuff. As an honest person and market player I, like Doc Hussman, think this needs to stop. That would be the right thing. Has the market finally broken the tools that have allowed the farce to continue all these years? We’ll find out soon enough.
Anyway, you can read Hussman’s most recent market comment here. It includes the contrary indicator and potential topping signal of Barrons’ “This market has legs… the bull is back” complete with picture of said bull on the cover. Hussman goes on about valuations, which he concentrates heavily upon. Again, you can get more details if you’d like to read his article, but for our purposes he notes conventional – and quite bearish metrics in play…
The problem here is that the S&P 500 now stands just 8% below its 2022 bubble peak. Whether it gets back to that peak, or not, doesn’t really change where we are in the cycle. Our most historically reliable valuation measures stand at or above their 1929 and 2000 extremes, exceeding every level seen in history prior to October 2020, with the exception of a few weeks surrounding the 1929 bubble peak. Meanwhile, our measures of market internals remain unfavorable, interest rates are nowhere near zero, long-term bond yields – as we’ll see – remain inadequate, and recession risk is quickly increasing.
All true, Doc. But the market is the market and before its eventual coming to terms with its excesses, the bubble will play out, if it has not already played out. To me, this is not a game. I am not here to make “coin” or be a sexy trader. I am certainly not here to promote an ideology or orthodoxy. I am only here to oversee the end of what I have considered a blight on the United States and indeed, most of the developed world.
In my opinion, the disinflationary backbone as illustrated by the chart above has enabled the Fed and its cohorts to systematically and exponentially further enrich the rich, impair the middle classes and hammer the poor over the course of decades. In effect, it has allowed monetary authorities (and governments) to ruin society. There, I said it. Those are my deeply held beliefs on the matter.
But I shelf all of that each day, take my blue pill and manage what we have before us as best I can. I do this while looking ahead and rooting for that Hoye squirrel to finally be right this time. This is not a joke. It is not a casino. I don’t care what gamblers (i.e. day traders) are doing. This is a blight on society and it has the potential to blow up. So you can add the Hussman, Prechter and even Tim Knight squirrels along with multitudes of crusty old gold bugs to the potential nut finding brigade.
I want to be ready to join them, after never having bought into their decades old futility. That is what NFTRH is trying to do here. Not maximize performance within what could be ending stages of the bubble. We called the bear market rally before anyone else that I noticed. That’s because it is my job to do that. But it is also my job to try to be clear about what we are dealing with on bigger pictures. What we are dealing with is a decades old policy-induced asset bubble and the possibility that we might actually oversee its end in the coming months or hopefully not too many years.
Meanwhile we work within an illusion. At least I do. You may well see it differently. It’s what makes a market. But what I, as a person, not a market management robot, see is a thing that has ruined society in some ways and greatly altered it in others. And it is at the hands of the magic known as Keynesian monetary policy, (funny) munny by government decree and a central authority in charge of acting as a regulator. In short and in highly technical terms, it sucks.
US Stock Market
That screed ended, let’s take a look at a primary bubble beneficiary. Of course I wanted to short it. Barrons has a contrary indicator on the cover! My long-term bias is that it is illegitimate! Finally, the pigs at the trough are going to learn their lessons!
Ah, no. While it is of course possible that SPX has topped, what we actually see on the daily chart is an overbought poke upward being corrected a bit as it declines to test initial support at the 4300 breakout point, or possibly even the thicker support around 4150, just below the rising 50 day moving average. Indeed, I would call that a bull flag pullback except that the volume profile is not bullish, with down volume larger than up volume. A bull flag would normally see progressively declining volume, whether any given day is up or down volume.

As for post-bubble shorting of the market, if I can stay disciplined then I would wait for a loss of the 200 day average or possibly a lower low to the March low of 3808. A real post-bubble environment would, after all, likely take much more air out of this flying pig.
The monthly chart takes us on a bearish fantasy exploration of what could happen in not only a post-bubble environment, but a normal bear market if we assume this is a bear market rally as originally projected. Bubble policy has made a mockery out of such assumptions for decades, but let’s stay open minded here.
Say that SPX puts in a top at or below the 4800 target (as somewhat humorously measured last December on a weekly chart) and a ‘C’ leg of an A-B-C correction to the ongoing bubble bull takes place. We’d be looking for a minimum downside of 3250 and/or the 38% Fib retrace level, where there is also clear visual support. That would be very mild. More likely, a drop to the 50% Fib area (2744) could take place rather than a gentle lower low (to the ‘A’ low) at the 38% Fib.
If we are terminating a bubble? Well, cast your gaze upon those two bubble highs in 2000 and 2007. 1500, baby. But first things first. It’s a technically intact and thus ongoing bubble as it has been for decades. Fact. If a correction starts and a new bear leg ensues then the bears need to hold that ball for much lower levels if the bubble is to actually end. They’ve failed to do that in every market liquidation throughout the bubble because policymakers are more powerful than they. Or they were more powerful (cue the potential implications of the Continuum’s breakout).

Global Stock Markets
Please take due note that local currencies play a role in market performance for global citizens. NFTRH being American, cannot get too far afield managing all those moving parts with my simple charts. So global market comments and charts are for reference.
Globally, we have developed world market bubbles varying with the levels of their own central bank and fiscal policy inputs. There is a view that the US is the root of all evil, I suppose because it is, well, the US. The leader, the Good Ship Lollipop, out front of the global armada.
Retreating to the technical situation, global (ex-US) is on a thus far normal pullback, dropping below the 50 day moving average. It stays normal unless the March low of 44.52, which successfully tested the upturning 200 day average, is taken out.

On weekly views we find hints of some damage starting in certain areas. While the World (ex-US) and Europe are okay, they painted ugly weekly candles last week that could prompt further selling. Great Britain continued to look suspect (at best), while Canada’s TSX made an ugly fade below what was unimpressive support. We’ve been noting that it and Australia’s AORD were suspect at best. Well, now TSX is breaking bearish.

Japan’s Nikkei took a red weekly candle for the first time in 9 weeks. It has earned a test of the upper support area, at least. Hong Kong Hang Seng faded support and EM had a down week while still in trend line breakout mode. India continues to go its own bullish way.
As noted in an update on Thursday, TSX-V slipped below the 50 and 200 day moving averages. On Friday it ticked lower still. The weekly view shows it continuing to slither along a very important support area. If that breaks down, say goodnight to the average speculative resource stock. As an interesting side note, da ‘V’ has actually been trending UP vs. the senior TSX in Canada since April. Not sure what that means, but it does bear watching as a possible hidden clue that the inflation trades may not be done yet (over the long-term, the TSX-V/TSX ratio has generally run in positive correlation with inflation expectations).

Brazil’s BVSP is still okay on its rally within a sideways neutral structure. Argentina shows how bubbles are done. Mexico took a 3.6% pullback last week but on a daily chart MXY has not even tested the SMA 50. So it’s normal. Africa ETF failed at resistance and is flat out bearish. Frontier markets ETF is poised above support and held its own.

Precious Metals
A public article on Friday went into detail about the yield curve and its likely future effect on gold (eventually beneficial when the curve steepens after this ‘Goldilocks’ flattener/inversion completes). Let’s recap it and review some other macro indicators to see where we’re at.
- 10yr-2yr Yield Curve: In an extreme inverted flattener. Bearish for gold, but by definition of its likelihood for a turn to steepening, a positive risk/reward indication on the longer-term. Let me rephrase that. By definition of its implied risk to cyclical/risk ‘on’ markets, gold as insurance is recommended soon, if not already held. Gold mining industry would leverage the implications of a deflationary curve steepener, perhaps after initial pressure at the hands of a deflationary event.
- Real Treasury Yields: The ‘real’, inflation adjusted 10yr Treasury yield is still well elevated and bearish. This implies the Fed is in control of inflation. If/when this drops under pains of economic weakness and deflationary pressure, it will flip to beneficial for monetary insurance, AKA gold because its implication would be either the Fed abdicating its fight against inflation or more likely the Fed forced back into its dove suit by precipitous declines in asset prices.
- High Yield Spreads: A little hook upward last week with the slight macro disturbance. Still depressed and not indicative of the forces that would send casino patrons scurrying for gold’s protection. Side note: remember, these indicator could all flip in a heartbeat. We are just noting what is going on in weekly snapshots.
- Libor/T-bill Yield: This indicator bumped up a bit but is not anywhere near the spike that came with the supposed banking crisis. Even that spike was nothing special as Fed and government worked together (and here is the caution about having much bravado on the end of the “everything bubble”; these macro riggers will seemingly stop at nothing to keep it going) to sanitize the situation.
Best Indicator of All?
That would probably be the over-bullish stock market backdrop. Check out the VIX, sitting in Drubsville despite the little correction going on in equity markets. Complacency, baby. And do you know what? This is bearish for gold because its history since Q4, 2022 has been a downtrend, which means an uptrend in complacency and the FOMO driven MOMO that followed it (likely signaling its ending stages). All of this is another way of saying the risk/reward proposition for monetary insurance, gold, is very positive even as bearish real time indications are in effect.

Here is the Smart/Dumb money graph (my markups) from Friday’s article linked above. The structure remains mostly the same, although smart indicators started to nibble the market and dumb ones faded further on Friday. But it is another high risk indication for stocks, by definition and so also by definition, it is risk/reward positive for the asset that is counter the bubble plays.

A precious metals specific sentiment indicator, the Commitments of Traders (CoT) remained aligned for a continued (and interim to the young uptrends) gold and silver correction. However, both metals got torpedoed last week after the CoT readings were taken. So it’s a good bet that next week will show a lurch toward a positive risk/reward situation. Probably not a complete one, but improved.
On to gold relative to risk ‘on’, inflation sensitive and cyclical markets, Gold/SPX dinged a lower low to February, which was not short-term positive. So now the October and/or December lows are the key ones. The pullback from early May is indicative of the increasing speculative dynamics in play for equities. When the rally terminates, gold’s insurance utility should come slamming to the fore.
Gold/Global actually held the higher low we were looking for, and turned up a bit. Worth keeping an eye on.
Gold/Commodities also took a little hook upward, while still in the corrective consolidation of the ongoing uptrends vs. these items.

The daily chart of the gold price held the first – and frankly not too impressive looking – support level we’ve been noting at 1920. To my eye, the correction looks incomplete. I’d like to see a drop to the SMA 200 (1855 and rising) at least. We’ll not rule out 1820 either. But for now, support is support until/unless it no longer is.

Silver is testing its daily SMA 200 now. So far it holds that area and the associated initial projected support at 22 (+/-). If gold tests its SMA 200 we’d probably see silver banging the support at or just below 21, which corresponds with the top of the shaded basing pattern. Again, all that’s needed here is a higher low to the March low to do two things: 1) provide a good buying opportunity and 2) maintain the series of higher highs and higher lows. Too much to ask? Nah…

GDX daily sees a hold of the first support level just below 30 and just above the upturning SMA 200 (29.15). I added a Fib detail of the correction from the previous rally leg. GDX dropped just below the 62% Fib, tried to bounce and was stopped at the May 30 low, which included that Fib. Still preferring a gap fill below 28 if not a hard and possibly concerning test of the March lows.
Side notes are a little positive divergence in play on RSI, trying to bookend the negative divergence that came at the May double top, and a MACD re-downtrigger. All in all, GDX is still very capable of filling the sub-28 gap, IMO.

An update noted that HUI dinged the upper end of the 220 to 230 target zone (and the daily chart’s SMA 200, which is not nothin’). Weekly HUI says not so fast bull boy. Risk/reward is good and bulls looking to position should be evaluating. But this chart feels a bit like a magnet set to 220-225.

Commodities
CRB Index: The big bounce failed right at the underside of the major daily downtrend marker, the SMA 200. Hence, no breakout and downtrend intact.
Crude Oil: Never bounced to the degree CRB did (it was largely driven by the big surge in the Ags) and trending down. OPEC+, ha ha ha.
NatGas: Okay, this is interesting. The basing pattern we’ve been tracking broke upward last week. Frustratingly, my Gas holding, AR, went down. But I am still holding it. It’s as if the market does not believe the move is real, as the Energy sector on balance (XLE) was also negative on Friday. If it is real, the daily chart shows a couple objectives for this unruly and volatile commodity. 1) the downtrending SMA 200 and 2) the first clear resistance level on the daily chart. If the bounce is real I am going with the SMA 200 at around 4, because that corresponds with the resistance of the 2021 low, not visible on this chart.

Copper/Industrial Metals (GYX): Copper got dinged hard on Friday, back below the converged daily moving averages. GYX is worse, as usual as it never even took out its moving averages and has remained locked in a downtrend. No interest, other than considering whether or not to try shorting cyclical metals miners again.
Uranium: Sector is pulling back but not yet broken. CCJ remains in a symmetrical triangle break, which is a minor technical positive and an uptrend, which is a better positive. But the sector is back under pressure and as the forward view is biased deflationary, well, not many cyclical areas would defy that if it engages prior to the next inflation cycle.
Lithium, REE, Palladium, Platinum, Nickel: Li is still plateued after its bounce from the support of its 2017 highs. I released LAC and decided to speculate less and watch the more reliable – and technically intact to an intermediate rally – LTHM and ALB, which are pulling back to test that trend. Strategic REE watch item MP is drubbed and likely impaired (IMO) by China’s price rigging. As the supplier of 70% of the world’s supply, they can pretty much set the market. But at some point, unless the US and China make nice nice, it should matter that MP produces at Mountain Pass in the US. Pd made a new low in its disgusting downtrend and Pt went hard down. We had noted that a Pt bull wants to see it make a higher low to the 903 low in February. After dinging 919.40 on Friday, it is time to either make that low or break down. As before, no personal interest in the PGMs, although the main watch list item is SBSW, which is getting killed (and should one day flash ‘bargain’).
Agricultural (GKX): Much like the CRB index, GKX made a hard smash upward and a hard smash back down from the downtrending SMA 200. I’ll have to evaluate whether or not to eliminate my NTR position. But being so cashed up I am giving some of this stuff (e.g. NOG, AR) some wiggle room. NTR has not started to break down, but its fertilizer bro, MOS, has.
Currencies
As usual, so much of the above can be distilled into what the global counterparty is doing and will do. What USD is doing is going sideways as it continues to hold the support area (not shown on this daily chart, but the weekly shows it at 101). The major daily trend (SMA 200) is trying to turn down as is that of USD’s macro liquidity destruction accomplice, the Gold/Silver ratio. Yet the rise in the GSR shows how meaningful that was last week; not very.
The indication here is that the two liquidity destroyers could be prepping to end the inflation trade aspects (such as they have been) of the broad rally, if not the entire rally. The GSR is a “metallic” spread between a more monetary, less inflation sensitive precious metal and a more speculative, inflation sensitive one. The view as it currently stands, with GSR potentially guiding USD, increases my already substantial caution on the broad markets.
The daily global currencies chart, for your review. Gold ally CHF is still trending up, JPY is breaking further bearish, EUR is neutral/positive bias, interestingly commodity currencies CAD (bullish) and AUD (neutral, bear bias) are diverging. I think that with the bearish state of the Canadian stock market, this indicates a grab for cash by Canucks seeking liquidity. The same can be said for the Brits and the British Pound.

Finally, a weekly chart of BTCUSD shows a renewed rise to test the resistance area. Apparently some large bank or brokerage announced a new Bitcoin tracker fund. Woo hoo! I don’t buy the hype, but then again, I never have. Technically, a break through resistance could set the price free. MACD seems to have doubt about that. In my opinion, Bitcoin is the same speculation it’s always been. Not an investment. But I am old fashioned.

Portfolio
Savings balanced by gold.
Trading Account: No positions
Roth IRA (non-taxable, no contributions)
Cash is 83% with a short position tucked in there. The look of the Gold/Silver ratio above makes me think cash will be raised further or shorting will be increased. The broad rally is not technically indicated to be over, but much more movement in GSR and USD may indicate it to be in much trouble before the technicals catch on. As has been the case for some time now, I am week to week and realizing the dual values of cash: 1) as dry powder for risk management and future deployment and 2) as a no-lose income payer.

Cash & income-paying Equivalents are at levels that are right for me and my real-world situation. Your situation is different. Cash will be adjusted as needed.
Refer to the Trade Log under the NFTRH Premium menu at nftrh.com for trade info, if interested (not that you necessarily should be). Also, you can follow at Twitter @NFTRHgt for notice of updates.
NFTRH is not to be distributed to third parties without prior written consent
Notes From the Rabbit Hole (NFTRH) is a weekly market report in which we provide analysis on financial markets. We make every effort to provide accurate and high quality content, but this analysis ultimately represents our opinions and these opinions are provided without warranty or guarantee of any kind. See full terms & conditions of service under the ‘About’ heading in the main menu.