This is a new segment for NFTRH, as of a couple of weeks ago. The report has all along included economic and macro data but as with the ‘Gold vs.‘ gold ratios segment, it was time for it to have its formal own real estate within the report. This way, anything notable from the previous week or hinting at cyclical changes (like the sectors and interest rates data directly below) can be addressed.
Economic Data & Trends
For reference, I’d like to present the graphic from Friday’s update showing the good and the bad with respect to a rising interest rate environment. From Citi:

Looking at September Payrolls who is surprised in the least to find Education & Health Services, Professional & Business Services, Retail Services and Leisure & Hospitality Services carrying the day once again? The economy continues to service itself. From BLS:

On a related note, when people out there in the financial media go on about declines in manufacturing employment it helps to remember that in manufacturing automation is Thing 1. The very nature of the beast is to replace human workers. Not to sound cold, but that is a fact. This continuum has been in play in one form or another since man fashioned the first tool to hit the other man over the head with, crush his skull and take his stuff. There is always a better way to do it and technology marches forward. For newer subscribers, I was in the industry for the better part of 3 decades and spent every minute of it under the burden of a self-imposed ‘automate or die’ directive.
On this subject, I have my eye on the Yen and Japan in general. Fanuc, a machine tool company so well hyped by suits pumping its Robot segment, may actually come into play here if the Yen drops for a trend. Japanese exporters would again become interesting and maybe even the (Yen-hedged) Japanese stock market. Let’s see how this develops. The subject of employment got the manufacturing guy off on a tangent. Back on theme…
Let’s end the segment with a quick look at the earnings season that has snuck up on us, with the help of Factset.com.

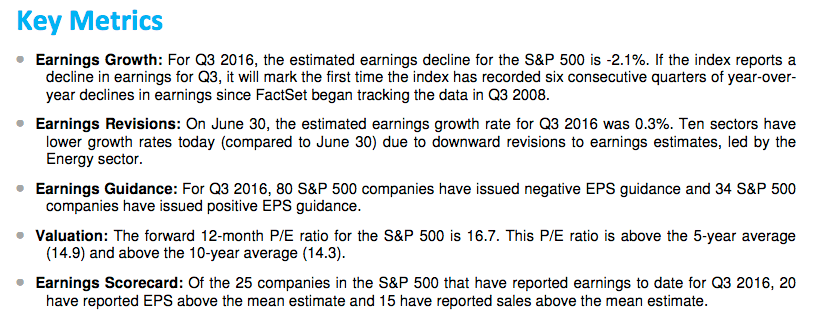
This graph shows S&P 500 earnings estimates vs. actual. The estimates have been trending up since bottoming in January and to no surprise, the stock market has had a decent year after the Q1 bearishness.

Factset’s observations are that actuals have consistently beaten estimates. I believe they call this setting the bar low, so Wall Street can easily jump over it right into bonus season. But I digress.
“Over the past four years on average, actual earnings reported by S&P 500 companies have exceeded estimated earnings by 4.3%. During this same time frame, 68% of companies in the S&P 500 have reported actual EPS above the mean EPS estimates on average. As a result, from the end of the quarter through the end of the earnings season, the earnings growth rate has typically increased by 2.9 percentage points on average (over the past 4 years) due to the number and magnitude of upside earnings surprises.
If this average increase is applied to the estimated earnings decline at the end of Q3 (September 30) of -2.0%, the actual earnings growth rate for the quarter would be 0.9% (2.0% + 2.9% = 0.9%). If the index does report growth in earnings for Q3 2016, it will mark the first time the index has recorded year-over-year growth in earnings since Q1 2015 (0.5%).”
One wonders how well this setup might be touted into year-end. A great setup for us would be for short-term bearish activity that sets sentiment to over bearish and positioning for a bullish year-end. It’s a plan, anyway.
Subscribe to NFTRH Premium for your 30-45 page weekly report, interim updates and NFTRH+ chart and trade ideas or the free eLetter for an introduction to our work. Or simply keep up to date with plenty of public content at NFTRH.com and Biiwii.com. Also, you can follow via Twitter @BiiwiiNFTRH, StockTwits or RSS.