Selling Media Hype; Gold Stock Edition
For the same reason I was forced to take profit on Semiconductor company LSCC, I have done the same on gold mine developer AKG. As with the LSCC media buzz,…
Putting on our conventional analysis hats (admittedly, not a hat I wear all too often) we see that the S&P 500 has happily continued higher despite a moderation in corporate…
Over at Biiwii on Monday we noted that a momentum leader to the US stock market - the Biotech sector - was abdicating leadership in favor of the momo driven…
A sleek and flowing 25 pages, NFTRH 340 was emailed to subscribers this morning. It continues a theme of quieting down the theory and focusing on what is happening. We…
I currently own 3 components of the venerable Dow 30 index, so today is fine. But the markets were driven down on China hype on Friday and up on same…
China, in a few pictures (courtesy of TradingEconomics.com): China GDP Annual Growth (through 2014)... China GDP Annual Growth trend projection... China Producer Prices... China Interest Rate... China Loan Growth.. China…
We noted in NFTRH 337 that the EM's were attempting to break through resistance. While this is just short-term stuff (longer-term charts remain neutral at best) the first 3 days…
Here is the S&P 500's closing price, target price and analyst ratings from FactSet... Nothing new or unusual here. A bunch of constructive to bullish analysts and a very few…
Biotech, an important momentum leader to the stock market, is going to need to think about finding support soon lest this become something more than routine. IBB has already made…
Excerpted from NFTRH 336…
US Stock Market
We start with our perspective chart in case there is any doubt. Janet Yellen is not to be taken so seriously, but the distortions built into this chart by post-2008 policy are.
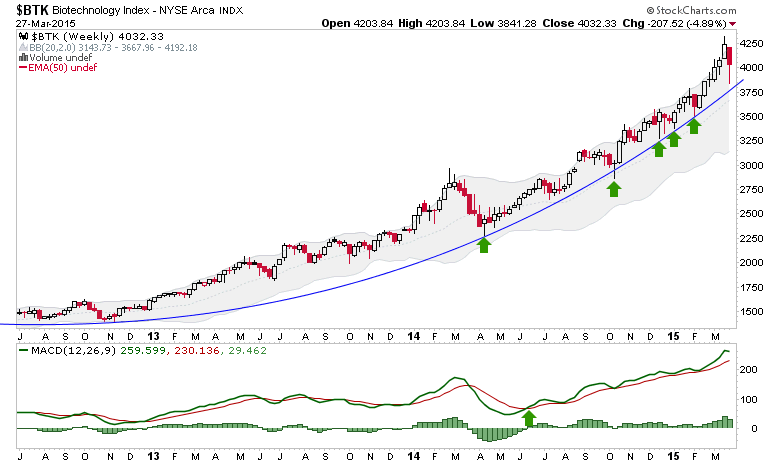
We will manage markets by daily charts with in-week updates as needed, but the weekly charts, beginning with the leading Biotech index continues to be just fine.
A trend is not broken until it is broken. This one is fully intact and last week’s put down or any to come that do not close below the blue arc line are just pullbacks within the trend. One day it will break and bears will say “I told you so”, but in the meantime BTK has been a guide instructing against active bearishness.
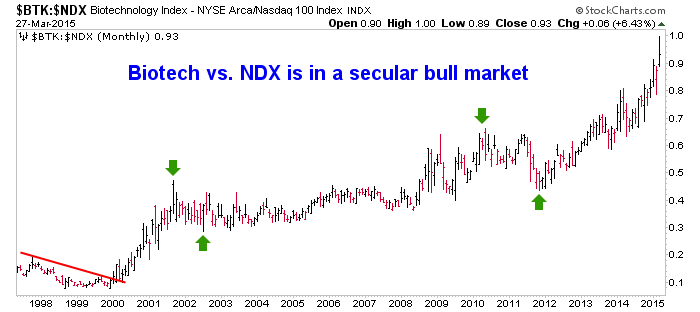
Meanwhile, Biotech continues to lead the Nasdaq 100 and more than that, the ratio is in a secular bull market. Now, I don’t want to go all bubble head on you but what is the implication here? To me, given the long-term nature of this chart one implication is that one technology really is standing the test of time vs. the average of so many other technologies, from critically important ones to those silly ones that allow people to take selfies and pictures of their food so they can bore other people with them.
In other words, I buy the Biotech story, long-term. That is different from calling Bio simply an important ‘momentum’ leader in the current late stage US stock bull market, which I believe it also is.
Yesterday we noted the Biotechs had lower to go, and lower they went. Typical of today's momo driven markets IBB took the express elevator right to the projected support zone…
I would be careful here on Biotech. The reversal candle signaled a fallout from a mini blow off. The level to which IBB became over bought implied the momo players…