A simple update using daily, weekly and monthly charts of the Lithium fund, for those who’ve done their research on Lithium and its end markets.
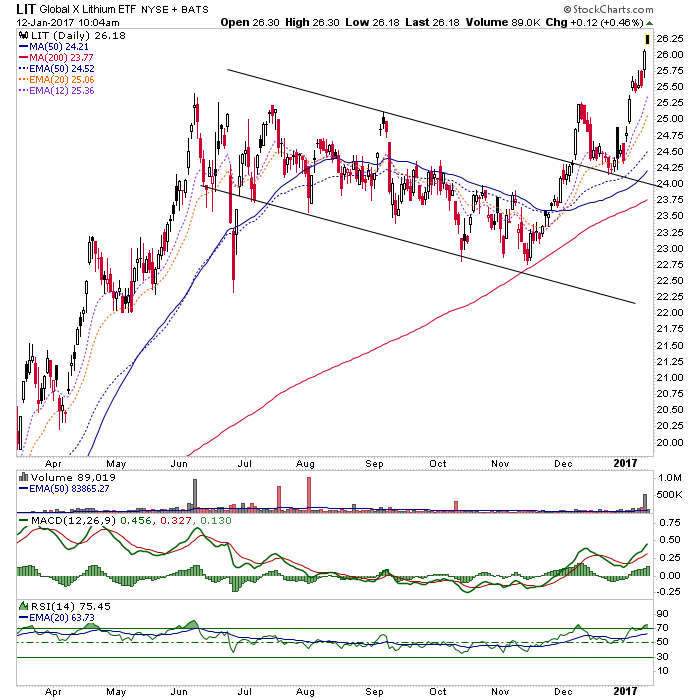
LIT daily broke consolidation and has risen in 3 waves to an overbought condition.
LIT weekly shows a breakout from an Inverted Head & Shoulders bottom a non-overbought condition. So while a short-term reaction could happen, it would likely be quick and shallow if the bullish breakout is to remain in play. Also, the implication is that momentum on the daily chart could build, rather than fade, short-term.

LIT monthly would target 33 based on a conservative measurement of the lows in the 16s to the black dotted neckline. It would measure to 42 based on the spike low of 14 to the resistance area around 28.

I am not going to formally list ‘buy’ levels here because of the variables in play. But 25 looks like an optimal buy if there is a short-term reaction. Otherwise, it’s strap in and take the volatility that could come into play as the pink resistance area is approached. The sell targets are self-explanatory and I would be strict about a stop loss below 22.70. A less tolerant stop loss would be below 25 and the breakout and neck lines.
A reminder that chart based NFTRH+ updates are technical trade setup ideas, which may not be revisited as the buy, sell, stop parameters are already noted. They are meant as a starting point for further research if interested. I will not personally buy every item highlighted and will sometimes sell – without prior notice (because this takes time and resource away from NFTRH’s main functions) – any item that I do buy, below target, which is something I often do as a trader. Also please be aware that I am not a fundamental stock analyst. Due diligence is your responsibility.