Using SPY for the US market and EEM for general Emerging Markets, I’d like to illustrate what I think may be in play on the short-term.
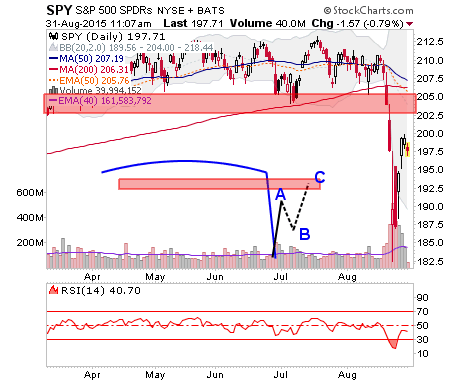
SPY shot up to the equivalent of our first S&P 500 target around 1980. This was based on lateral resistance (not shown on the chart below) and a 50% Fib retrace. We also have an ultimate potential upside (corrective) target equivalent to SPX 2040. That is the thick red zone on the SPY chart below.
If this scenario proves to be correct, current weakness would be the ‘B’ leg down of an A-B-C upward correction of the recent and hard down leg. There is a good chance that the lows would be tested even if a bull scenario is eventually to emerge, and we could expect that decline to come from or below the red resistance zone.
The upshot is that I want to be patient in shorting this market, because I think there may be another pop higher. I may even think about playing that pop with a quick bullish stance. I have not decided on that as I reside comfortably in cash. More importantly, this is a potential road map of what I think could be another bearish setup at around SPX 2040 (SPY 204).
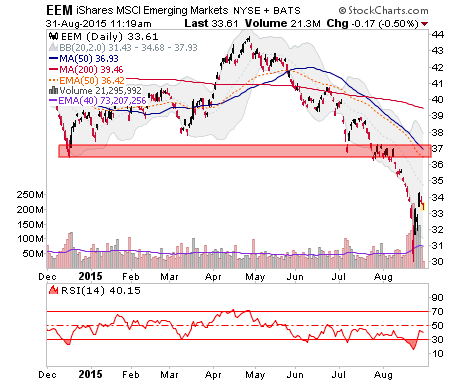
Similarly, EEM is bouncing as well. Here we recall the longer-term bearish setups that EEM and many global markets are in. The bounce can also be watched as a potential A-B-C. We had noted that 36 might be a shorting area by weekly chart. Let’s refine that as 36 to 37 by the daily chart.
Of course, there are other short-term scenarios for markets. But this one seems the most likely and logical.