Doctor Copper’s scrip: “The economy is starting to gear down due to the reduction of the very cyclical inflationary forces that had stimulated the patient previously. If you feel a sudden loss of balance, as if a carpet were being pulled out from under your feet that will be the inflation trades you’ve stood resolutely upon continuing from a normal correction to an erosion of uptrends.”
The copper price (futures) are stabbing the lowest level yet of this long dirge that has been our chronicling of the situation.

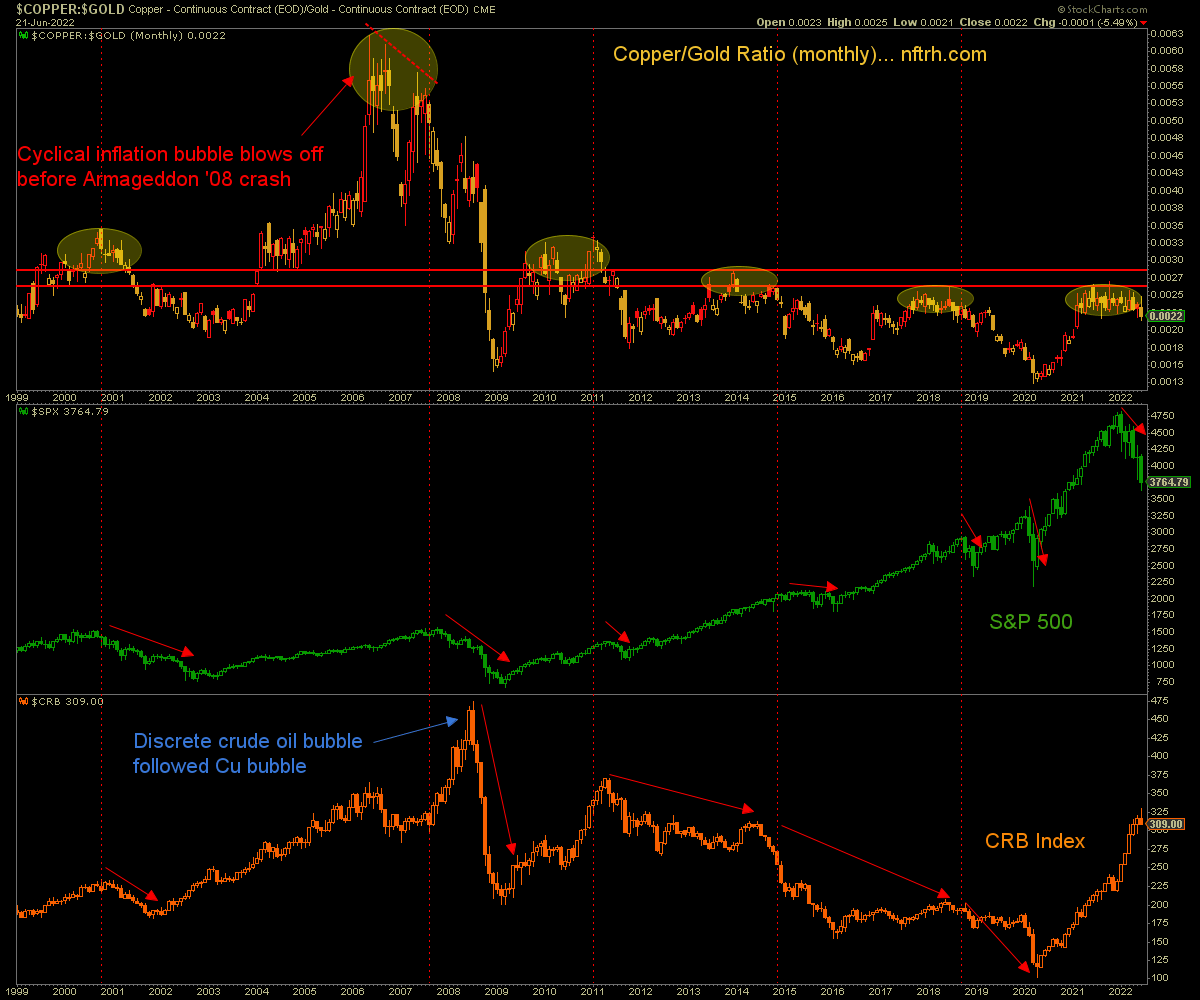
The Copper/Gold ratio (CGR) is even more important in signaling a failure of the 2020 inflationary operations. That is not to say that the inflation will not resume, but it is to say that we are now in a decidedly counter-cyclical, economically corrosive phase of it (enter the Stag). The other alternative is a complete failure of the inflation on the near to intermediate-term into a liquidity crisis.

The big picture chart advises that the S&P 500 got a head start on the proceedings by entering a bear market as CGR was merely consolidating with its bearish bias, while commodities – driven by the last inflated man standing, Energy, continued apace. If Copper/Gold fails badly the last inflated man is not likely to withstand it.
For “best of breed” top down analysis of all major markets, subscribe to NFTRH Premium, which includes an in-depth weekly market report, detailed market updates and NFTRH+ dynamic updates and chart/trade setup ideas. Subscribe by Credit Card or PayPal using a link on the right sidebar (if using a mobile device you may need to scroll down) or see all options and more info. Keep up to date with actionable public content at NFTRH.com by using the email form on the right sidebar. Follow via Twitter@NFTRHgt.
Thank you for this analysis.
Are the above charts suggesting that the 50 day SMA can be used as a trend reversal indicator for buying and selling? If not, what useful information does this or any other MA actually convey? Looks to me like the success rate in retrospect would not be much better than 50% and you would have to do a lot of expensive churning in the phases with sideways movement.
And it seems just as difficult to identify areas of support and resistance in the Cu chart because the maxima and minima are all over the place. They are a bit better defined in the Cu/gold ratio chart, it seems.
Generally, I use the daily SMA 50 as an intermediate trend guide and the SMA 200 as a more major trend guide (still within daily chart time frames). There are often whipsaws above and below moving averages (and support/resistance). But the slope of the MAs is what is important in understanding the trends.