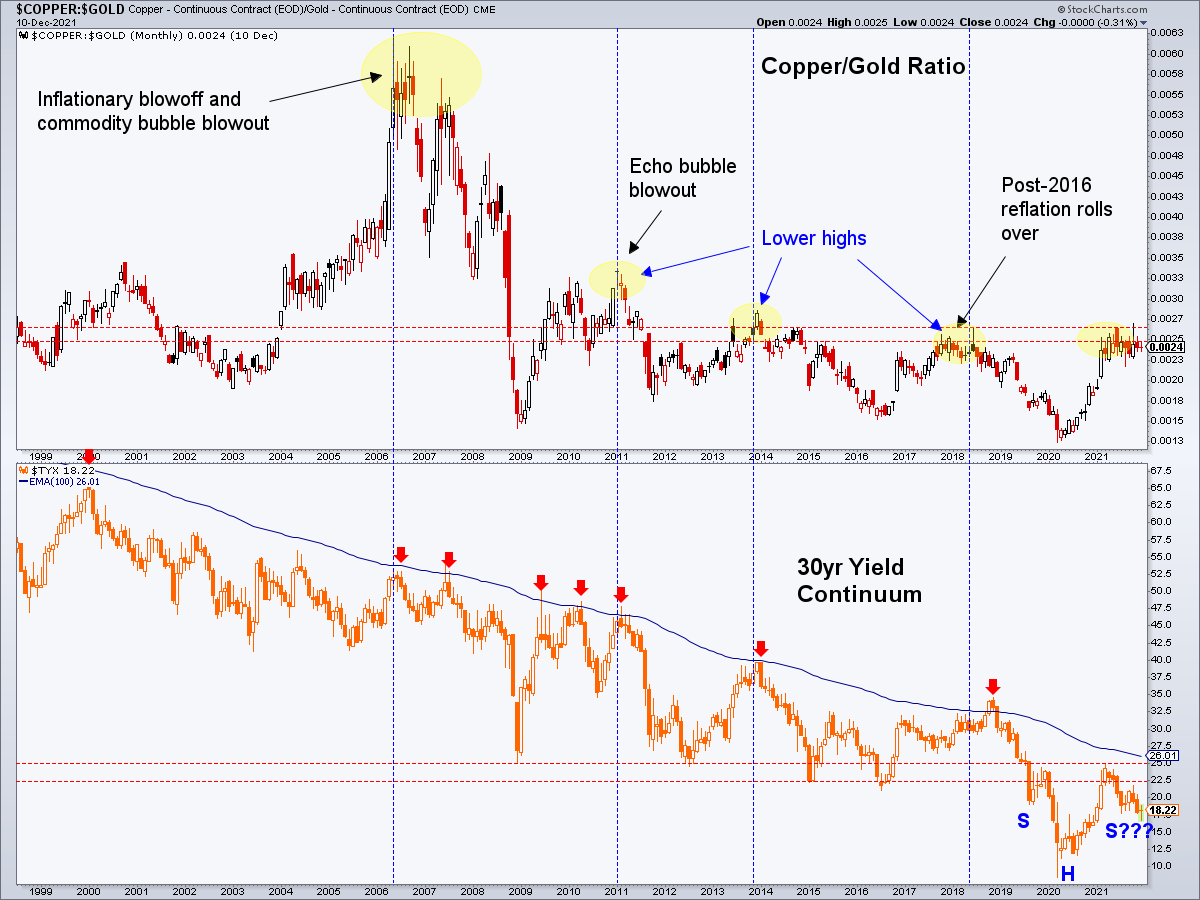
The Copper/Gold ratio continues sideways…
…keeping wide eyed macro watchers (or at least this macro watcher) in suspense.
I just don’t think it is wise to be caught guessing as we pass through the doorway to 2022. The Copper/Gold ratio, like so many other macro indicators, refuses to give its signal just yet.
The implication of this ratio is cyclical inflationary if this proves to be a consolidation prior to a new bull move, or counter-cyclical and possibly the inflated boom’s end if it breaks down. Two very different outcomes and as yet the ratio is not showing its cards.

The daily chart above is actually playing out at a very important historical level. Cu/Au is at a potential limit point, which pretty much by definition also means that it is at a potential breakout point. Lurking, lurking, lurking as it has for nearly all of 2021. 2022 gonna be different. At some point the lurking will cease and direction – by which we may position in the markets (long and/or short) – will be had.
For “best of breed” top down analysis of all major markets, subscribe to NFTRH Premium, which includes an in-depth weekly market report, detailed market updates and NFTRH+ dynamic updates and chart/trade setup ideas. Subscribe by PayPal or credit card using a button on the right sidebar (if using a mobile device you may need to scroll down). Keep up to date with actionable public content at NFTRH.com by using the email form on the right sidebar. Follow via Twitter @NFTRHgt.