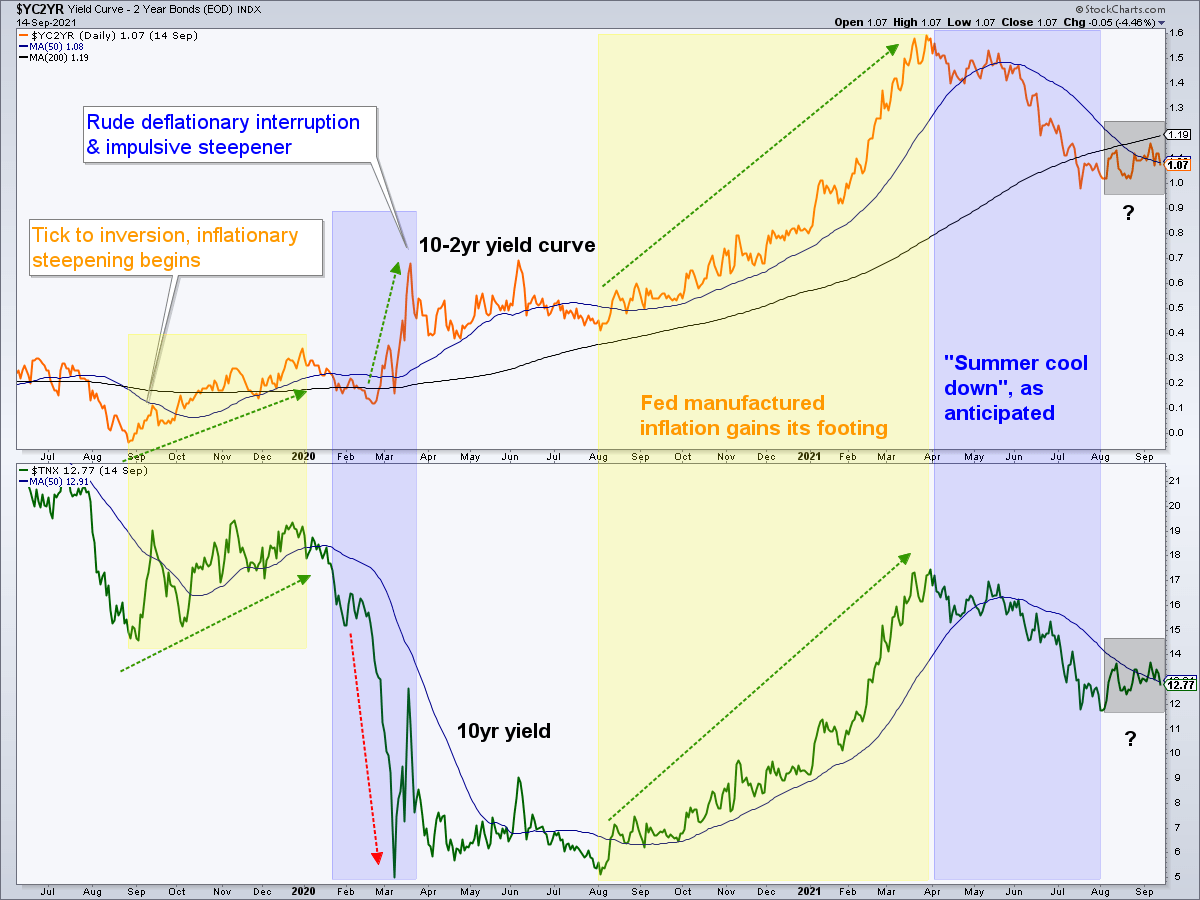
The yield curve and the nominal 10yr yield are at a critical macro juncture
The chart attempts to tell you what I think without me interfering, right up until August, 2021.
As for the current grey boxes highlighted for the yield curve and the nominal yield, I’ll tell you what I think. I think that another inflationary steepener has tried to get going (as evidenced by the nominal yield also lamely rising (bear flagging?) along with a lame attempt at a curve steepening.
I also think that the near perfect unison between these two will get torn asunder if the curve steepens again under deflationary pressure (ref. Q1 2020). If they both rise together the indication will be inflation, part 2 (likely with a growing Stagflationary element to it). The third option is Goldilocks, where nominal yields remain relatively subdued while the curve flattens. With all of the inflationary inputs in this market I see that ‘not to hot, not too cold’ blessed state as the least likely.
It’s either going to be intensifying and more destructive inflation or an utter failure of said inflation into the usual deflationary liquidation.
For “best of breed” top down analysis of all major markets, subscribe to NFTRH Premium, which includes an in-depth weekly market report, detailed market updates and NFTRH+ dynamic updates and chart/trade setup ideas. Subscribe by PayPal or credit card using a button on the right sidebar (if using a mobile device you may need to scroll down). Keep up to date with actionable public content at NFTRH.com by using the email form on the right sidebar. Follow via Twitter @NFTRHgt.