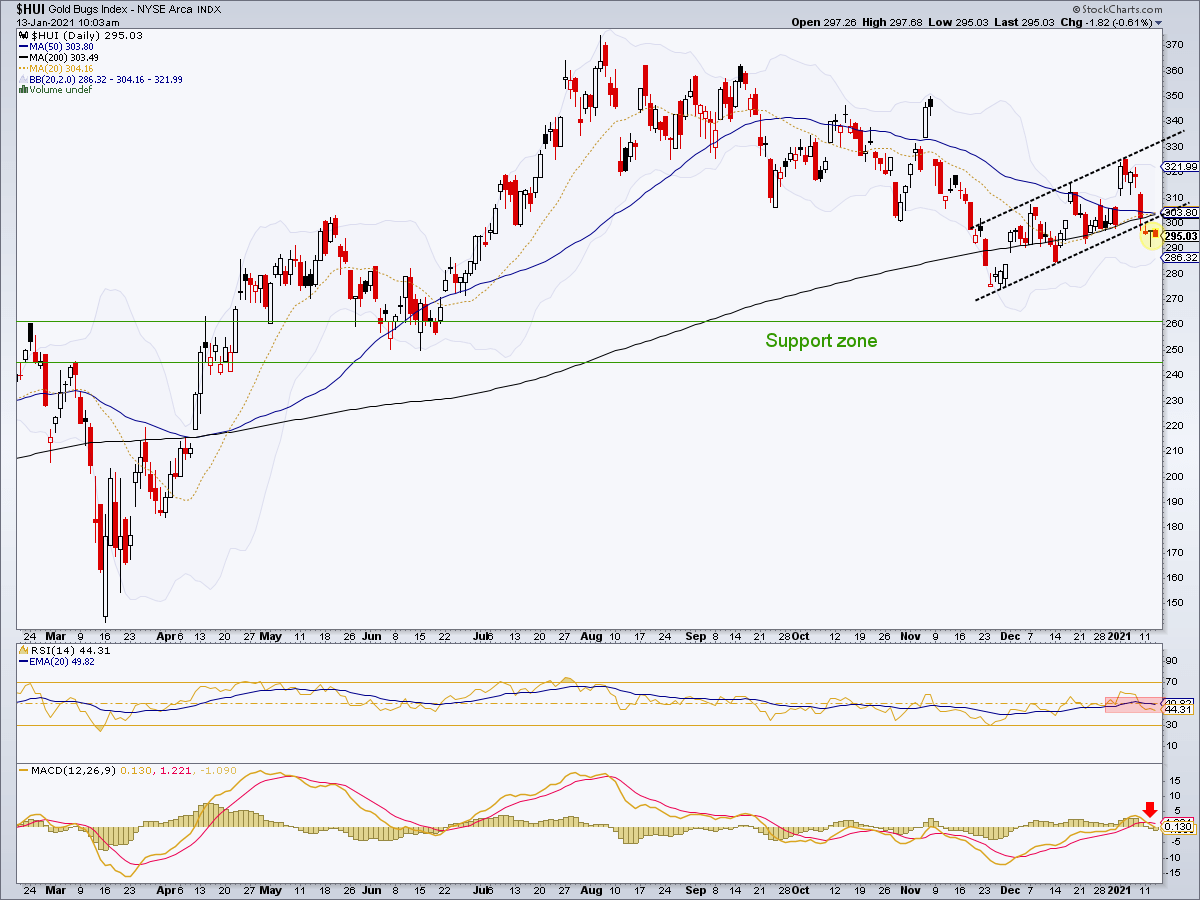
[edit] To clear any confusion, Target #2 is the 260 +/- zone we’ve discussed for several months. Drawn in detail here, it is the noted support zone, biased to the (-) end of the +/-.
Stripping out all the noise of the HUI daily chart we have used to manage the correction to this point, let’s simply note that technically speaking, with the drop below the moving averages, it is in an active bear flag breakdown posture. RSI is holding negative and MACD is crossing down from a positive position.
It almost seems too obviously (short-term) bearish, which is why I’ve had a little doubt. But if the technicals do follow the current setup our #2 target would be the next objective.