As long as the market keeps bulling (and the Dow still has that upside gap) we are going to keep managing bullish rather than bearish charts. I saw this daily chart today and the nerd in me… well, you know what he did. He got excited.
I added PFE and a strict tolerance on that could be the area where noted support meets the rising EMA 20 at around 38. A less strict tolerance could be the converged SMA 50 and SMA 200.

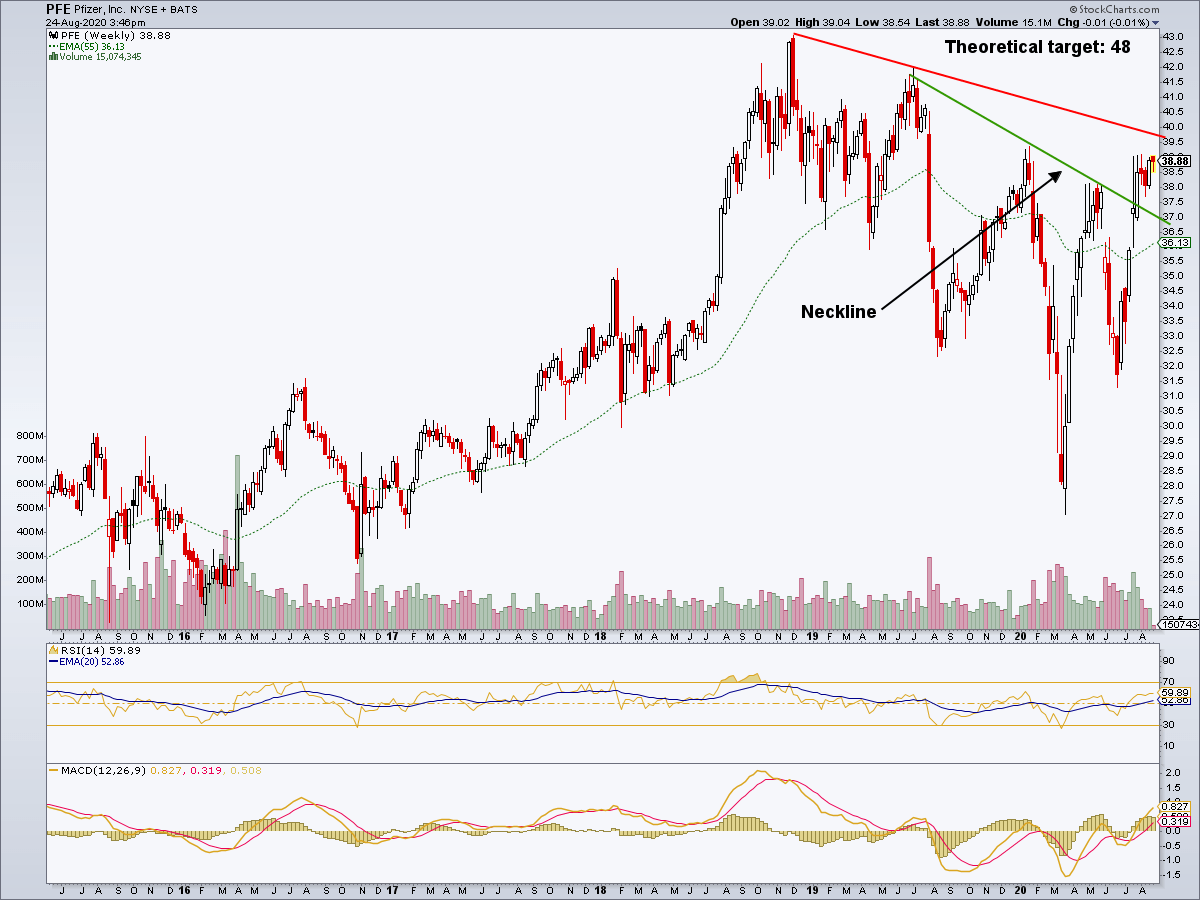
I then pulled up the weekly and noted that the pattern’s neckline has been broken to the upside, although there is another trend line above 39. On both charts RSI and MACD look ship shape so I thought it was worth a shot. I will likely not tolerate a drop to the daily SMA 50 and 200. But that does not appear to be the direction this thing is looking (pending the market of course).
A reminder that chart based NFTRH+ updates are technical trade setup ideas, which may not be revisited as the technical parameters are already noted. These updates are meant as a starting point for your further research if interested. I will not personally buy every item highlighted and will sometimes sell (ref. Trade Log) any item that I do buy below target (assuming I’ve not stopped out or sold for some other reason) as I often do. Also please be aware that I am not a fundamental stock analyst. Due diligence is your responsibility.